Get Worldwide App Download & Revenue Estimates for any App
 by Laurie Galazzo
Chief Revenue Officer at AppTweak
— 8 min read

AppTweak is an ASO tool pioneer! Since 2016 we also provide app market intelligence data for both the Apple App Store & Google Play Store in more than 70 countries. In this article we’ll explain in more detail how we calculate these estimates, how you can find download and revenue estimates for any app in the store and how you can use AppTweak’s Market Intelligence feature to analyze download and revenue estimates across an entire category or country.
App Download & Revenue Estimates in 70+ Countries
Understanding the market, past & current trends but also your competitors’ performance in terms of downloads and revenue can help you make better decisions.
Furthermore, seasonality is an important exogenous factor that can help explain certain trends and variants in your app’s success. Having a global understanding of your market will help you identify new opportunities and explain some discrepancies.
Since 2016, AppTweak provides app download and revenue estimates for any app in more than 70 countries in both the Apple App Store and Google Play Store. More recently, we also launched a new Market Intelligence add-on to help you analyze app download and revenue trends across an entire category or country.
Learn more about our Market Intelligence Feature
Transparency: How we calculate App Download & Revenue Estimates
Transparency is one of AppTweak’s 3 main values. To help users optimize their ASO strategy we want to make sure they fully understand how we gather and calculate our data. We believe this is important as it will help users make more informed decisions on how to optimize their app. This is why we want to explain in more detail how we calculate our Download and Revenue Estimates.
The process is quite simple and starts with data collection. AppTweak users are able to connect their Apple and Google consoles to AppTweak. AppTweak then encrypts all the data and stores it in a secure database.
Important: This off-course does NOT mean that we share your data to any third party. Be 100% reassured, your data is anonymized, encrypted and safely stored.
Our data scientists have developed a strong machine learning algorithm that correlates app downloads and revenue with app rankings.
To explain this in further detail, have a look at the concrete example below.
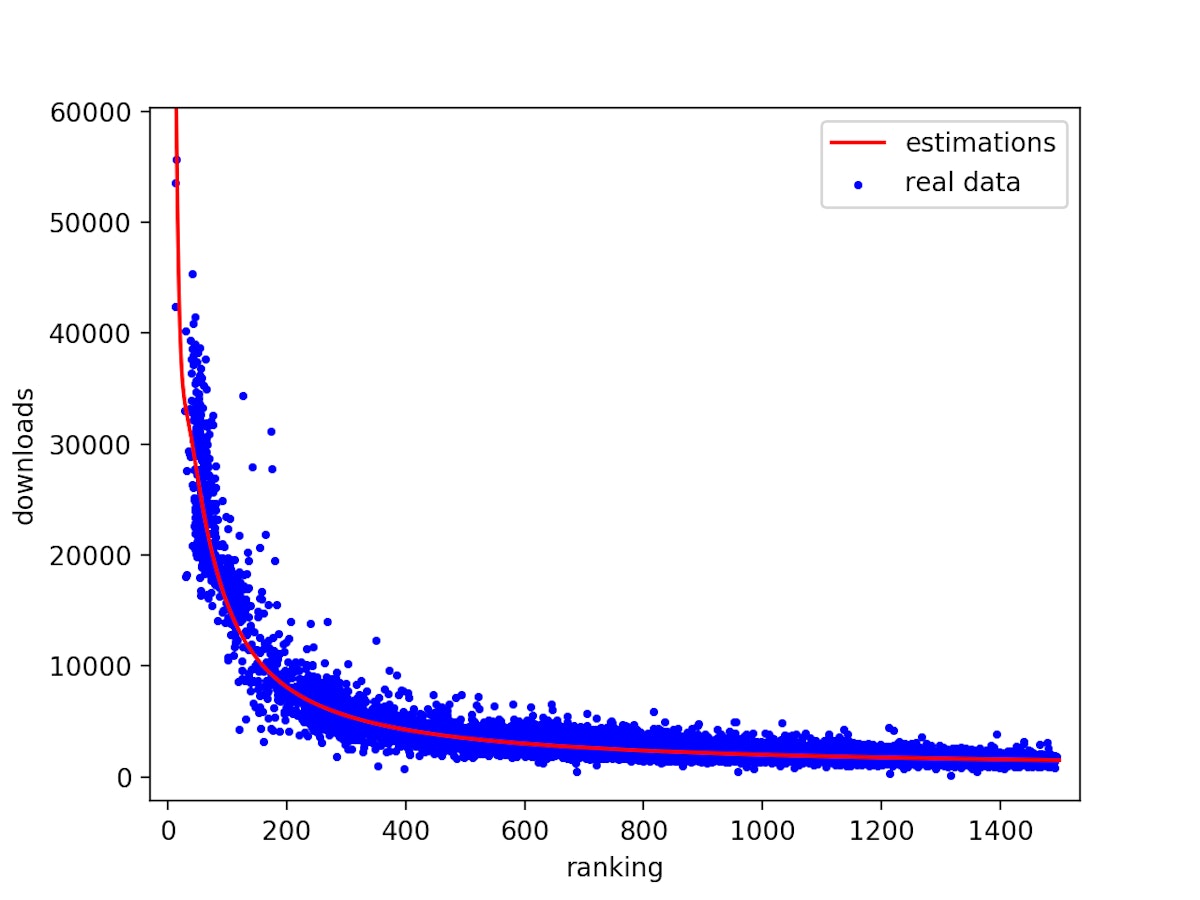
The graph shows both our “real data” (blue dots) vs “estimations” (red curve) for apps in “All Categories” in the United States.
The X axis is the spread of app rankings (from 1 to 1500) and the Y axis shows the amount of daily downloads (from 0 to 60,000).
As you can see, the higher the ranking, the higher the number of daily downloads. Inversely, the lower the ranking, the lower the amount of downloads.
When mapping all these blue dots together, we see a trending curve which our data scientists then standardize into a more general predictive curve (red line).
For any given app, our Machine Learning technology will screen the app’s category and rankings. From there, it will be able to provide the user with an estimation of the daily downloads.
The app revenue estimation machine learning algorithm works very similar. But instead of mapping app downloads with category rankings, we map daily revenues with app rankings in the top grossing category.
Check out this article for a more detailed explanation on how we calculate our download estimates
3 Confidence Indicators: MODERATE – FAIR – ACCURATE
The more data we have, the more accurate our predictive curve will be for a given category in a given country.
Furthermore, the level of accuracy also depends on the ranking tier the app is in. E.g: is the app you’re tracking a very powerful app or is it a newly launched app with very low and volatile category rankings? The ranking tier does influence the accuracy of our data as we may have more or less data points for a given group of rankings.
You therefore need to take into account our confidence indicators while interpreting our estimates and take into account the level of accuracy for the app you’re looking at.
- MODERATE: The level of accuracy for the estimates you’re looking at is moderate. We don’t have a lot of real data points for the given category / country / ranking tier. It’s a rough estimation, that is more useful in terms of comparison between apps rather than providing an actual number of downloads or revenue.
- FAIR: The level of accuracy for the estimates you’re looking at is medium. We have a fair amount of real data points for the given category / country / ranking tier. Although you still need to be careful while interpreting the data provided, these most likely have a good correlation with the exact data.
- ACCURATE: The level of accuracy for the estimates you’re looking at is high. We have a lot of real data points for the given category / country / ranking tier. We guarantee that our estimates are highly accurate in this case. They should reflect very well the real number of downloads and/or revenue of this app you’re looking at.
How to access the Download and Revenue estimates?
All AppTweak users that have an active Guru or Power plan can access the Download and Revenue estimates in the “Analytics” tab of any app in their dashboard. Note however that Download & Revenue Estimates are not available during the free trial as this is data with very high value.

At the top of the graph you can see the total downloads and average daily downloads for the analyzed date range (you can adjust the date range easily in the top right corner – we have data available since 2016!). Next you can see the confidence score and select the device for which you want to analyze the downloads for.
Note: Apple does not make a distinction between devices in all their graphs in their console. So if you compare your AppTweak’s estimates with your real data, make sure to combine the iphone and ipad download estimates.

Below the graph you can view the data in table format. You can also choose to export the data in png or csv format by clicking on the download icon on the top right of the graph.

Using the “World Map” view you can quickly spot from which country the given app receives the most app downloads or revenue. Here again, the data presented on the world map is also displayed in a detailed table right below.
With the Guru plan, you can have access to app download and revenue estimates in 20 countries:
Australia, Belgium, Brazil, Canada, Germany, Spain, France, United Kingdom, India, Italia, Japan, Russia, Sweden, United States, Denmark, Norway, Finland, Luxembourg, Switzerland, The Netherlands
The Power plan unlocks app download and estimates for all countries (+70):
Argentina, Brazil, Canada, Chile, Colombia, Ecuador, Mexico, Peru, United States, Uruguay, Venezuela, Austria, Belarus, Belgium, Bulgaria, Croatia, Czech Republic, Denmark, Estonia, Finland, France, Germany, Greece, Hungary, Iceland, Ireland, Italy, Latvia, Lithuania, Luxembourg, Netherlands, Norway, Poland, Portugal, Romania, Russian Federation, Serbia, Slovakia, Slovenia, Spain, Sweden, Switzerland, Turkey, Ukraine, United Kingdom, Australia, China, Hong Kong, India, Indonesia, Japan, Korea, Kazakhstan, Malaysia, New Zealand, Pakistan, Singapore, Taiwan, Province Of China, Thailand, Vietnam, Philippines, Israel, Jordan, Kuwait, Lebanon, Oman, Qatar, Saudi Arabia, United Arab Emirates, Algeria, Egypt, Nigeria, South Africa, Tunisia, Zimbabwe.
If you are on the Starter or Pro plan, you are more than welcome to upgrade in order to access this data right away.
Upgrade today to access App Download & Revenue Estimates
Advanced Market Intelligence Data
On top of that, AppTweak also contains a Market Intelligence add-on that provides you with information on app download and revenue estimates across entire categories or countries.
Here are a few examples of the data you can unlock with this add-on:
- Compare download and revenue estimates across categories or countries

In the UK, the Business Category receives more downloads than the Finance category.
- Find out how many downloads your app will need to rank in the top 1, 10 or 50 in its category

To rank #1 in the Games Action category in the US Apple App Store a game needs on average 170K daily downloads.
- View app download seasonality trends for your app category

Travel apps receive most downloads in June and least downloads in November. People tend to download travel apps more during the weekend.
- Benchmark your app performance against your category

The selected app experienced a steeper decline in downloads in December than the category average.
The Market Intelligence feature is available as an add-on to any AppTweak subscription.
Learn more about our Market Intelligence Feature
Export App Download & Revenue Estimates via API
If you are looking to analyze app download and revenue estimates for a large range of apps you can export the data quicker and more easily via our API. Our RESTful app store intelligence API provides direct access to more than 3 million apps worldwide.
To export data via our API you need to buy a set of credits. These credits can then be used to make calls to the API.
Learn more about API credits & pricing
Our detailed documentation guide outlines in detail how you should structure your calls to retrieve the right information.
Unlock download estimates for any app in the Apple App Store or Google Play Store! Got any questions? Reach out via the chat below!
Related posts
 AppTweak ReleasesReviews and Ratings
February 28, 2024
Learn about how the App Reviews Manager can help you scale your app store reputation.
 AppTweak ReleasesCompany Announcements
February 22, 2024
In 2014, AppTweak began as one of the first ASO tools. Fast forward 10 years, and we’re the first choice …
 AppTweak ReleasesSearch Ads
February 5, 2024
Apple Search Ads (ASA) is a powerful tool for app marketers and UA managers to connect with new users on …
 AppTweak ReleasesSearch Ads
January 18, 2024
Learn about AppTweak’s Search Ads Manager, a complete tool to create, manage, and scale ASA campaigns by uniting ASO & …
 AppTweak Releases
December 18, 2023
AppTweak’s yearly product recap – a non-exhaustive overview of our favorite releases for mobile marketers, all launched in 2023.
 AppTweak Releases
November 14, 2023
Grow your ASO knowledge with ASO with AppTweak course & certification.
 Georgia Shepherd
 Oriane Ineza