
Apple Ads benchmarks are standard performance metrics that help app marketers evaluate campaign efficiency by category, country, placement, and campaign type. Key metrics include cost per tap (CPT), cost per install (CPI), conversion rate (CR), tap-through rate (TTR), and cost per mille (CPM).
This page combines two AppTweak datasets. Global, country and placement benchmarks come from AppTweak’s Campaign Manager benchmark: nearly 3,500 apps, 50,000 campaigns and $1B in ad spend across 38 countries and all four Apple Ads placements (search results, Search tab, Today tab and product pages). U.S. category, campaign type, custom product page and seasonality benchmarks come from the ASO and Apple Ads trends and benchmarks report 2026, based on ~2,800 advertisers running U.S. Apple Ads campaigns tracked by AppTweak in 2025.
Key takeaways
- The global median cost per tap (CPT) in search results is about $0.92, and $1.91 in the U.S. (Campaign Manager benchmark, 2025).
- In the U.S., median cost per install (CPI) ranges from $1.33 for Shopping to $26.70 for Sports, with Games at $4.63 (~2,800 U.S. advertisers, 2025).
- For apps, Brand campaigns have the lowest median CPI ($2.84) and Competitor campaigns the highest ($6.78). For games, Discovery is the cheapest at $1.34.
- Brand campaigns convert best: TTR 25.3% and CR 73.5% for apps.
- Apps using custom product pages convert taps to installs at 58.7% versus 55.5% on the default page, yet 61% of apps and 74% of games ran none in 2025.
- CPT runs below each advertiser’s own annual average in Q1 and peaks in Q4: Generic campaigns reach +8.8% in November.
- After Apple Ads introduced additional ads in search results in March 2026, Discovery campaigns saw the largest reach gains (impressions +44.9%, installs +35.8%) while CPT fell for Brand, Generic and Competitor campaigns.
- Each placement plays a distinct role, and conversion is highest in search results.
About the data
U.S. benchmarks (report): ~2,800 advertisers running U.S. Apple Ads campaigns tracked by AppTweak, January to December 2025, search results placement unless stated. Category figures are medians across monthly app and campaign rows, so they are robust to outliers and not weighted by spend. Campaign types (Brand, Generic, Competitor, Discovery) are classified by AppTweak based on each campaign’s intent. This is paid media data; it contains no revenue, ROAS or lifetime value. The universe is AppTweak’s Apple Ads integrations, not the whole App Store.
Global and country benchmarks (Campaign Manager): nearly 3,500 apps, 50,000 campaigns and $1B in ad spend, 38 countries, four placements, 2025. Because the two datasets cover different advertisers, a U.S. figure in a country table is not directly comparable with a U.S. category median.
Key Apple Ads metrics definitions
Tap-through rate (TTR): Tap-through rate is the percentage of users who tap after viewing your ad. TTR is calculated by dividing the number of taps by impressions.
Conversion rate (CR): Conversion rate (CR), also called tap-to-install conversion rate (CVR): the percentage of taps that result in installs; installs ÷ taps.
Cost-per-tap (CPT): Cost-per-tap is the average cost per ad tap. CPT is calculated by dividing spend by the number of taps.
Cost-per-acquisition (CPA): Cost-per-acquisition measures the total cost spent to acquire a new user. CPA is determined by dividing total spend by the number of installs.
Cost-per-mille (CPM): Cost-per-mille measures the cost per one thousand impressions. CPM is most relevant for awareness-driven placements like Today Tab and Search Tab, where impression volume is high.
Return on ad spend (ROAS): Return on ad spend is used to understand the efficacy of a campaign. You can calculate ROAS by dividing the revenue made from the campaign by the amount of ad spend spent on it.
Retention rate: Your app’s retention rate measures the percentage of users who continue to use it over a set period of time. After you set the time period, you can find the retention rate (percentage) by dividing the remaining number of users by the end of this period by the number who started at the beginning, and multiply by 100.
Performance by placement
Apple Ads offers four key ad placements on the App Store: Search results, Search Tab, Today Tab, and Product Pages. Each placement serves a different purpose in the user journey, and their performance benchmarks reflect these differences.
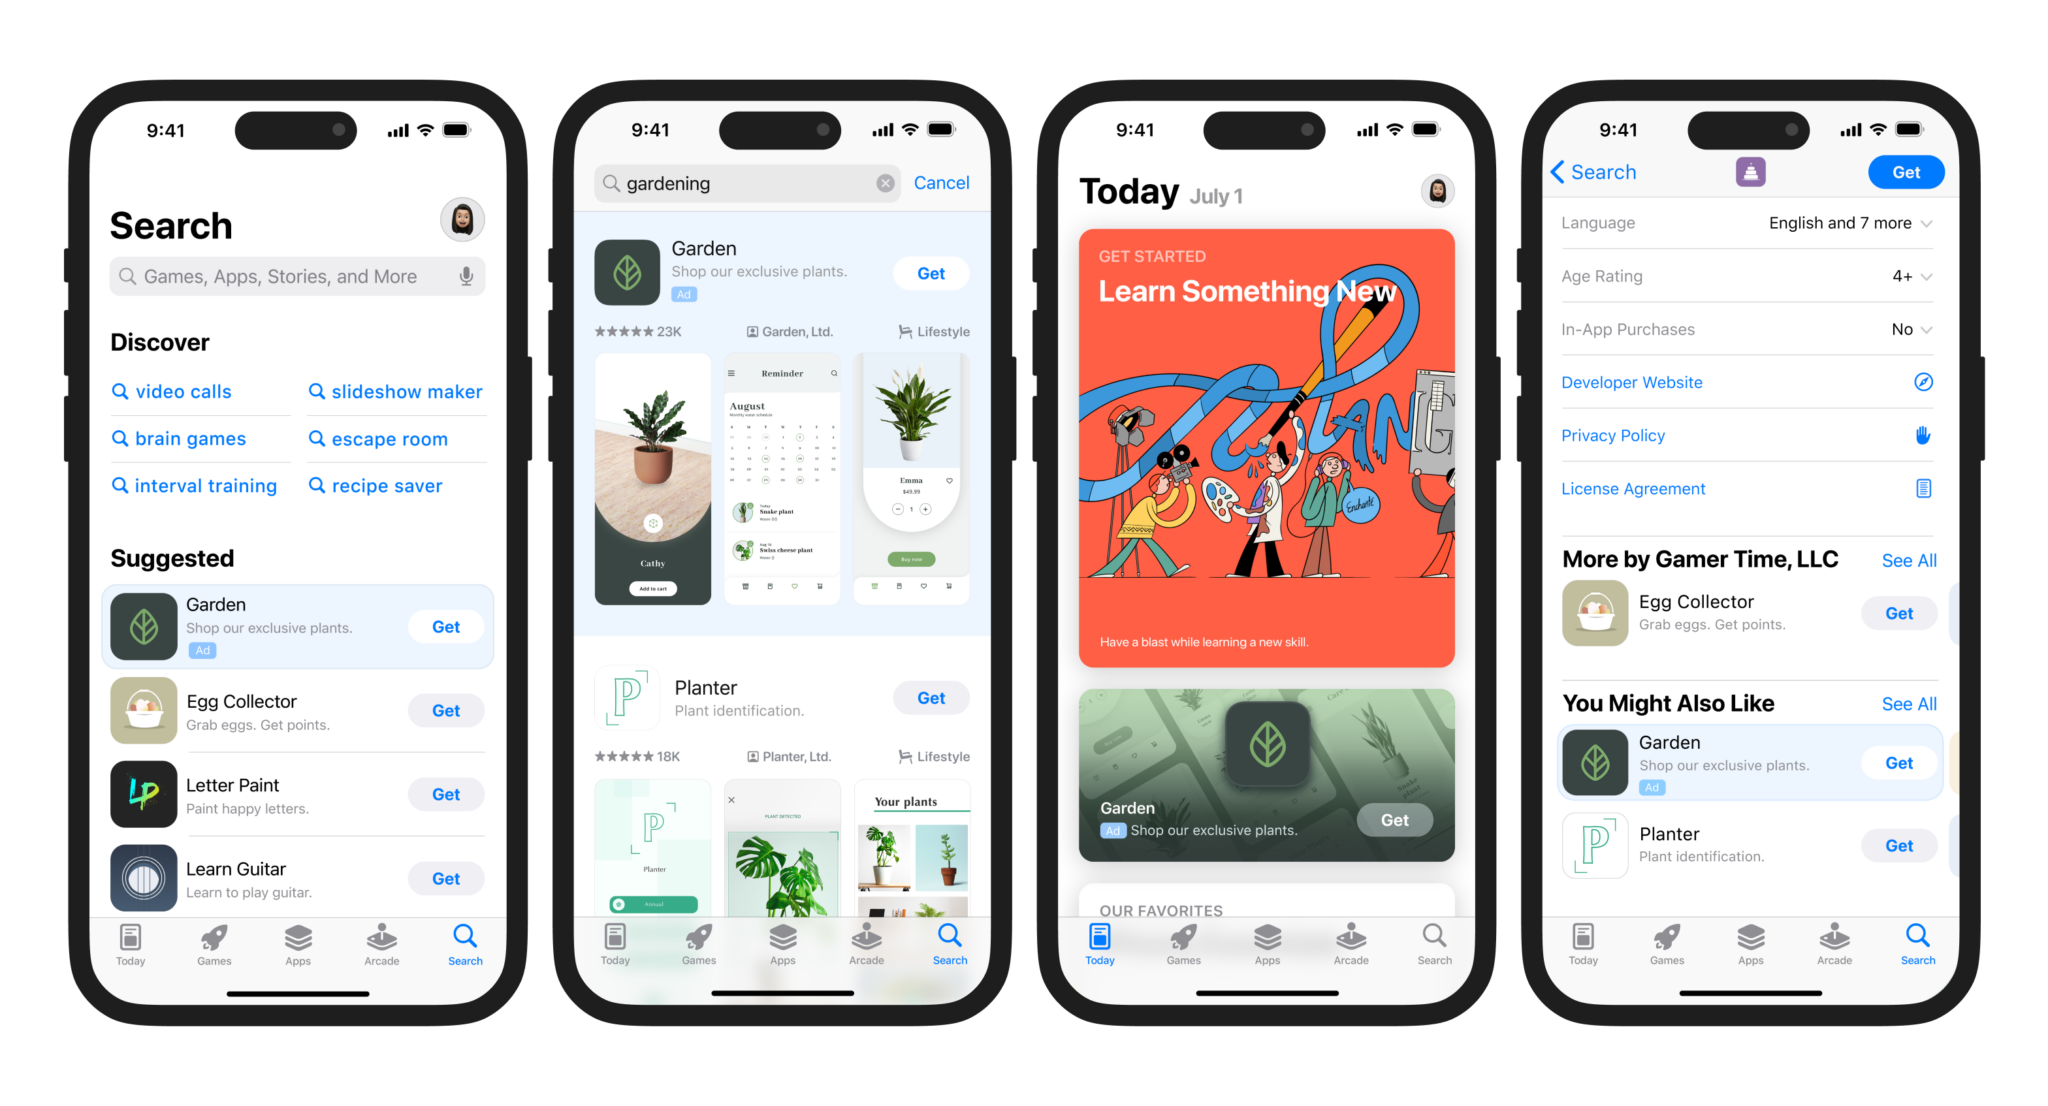
Search results: high intent, high performance
Around 65% of App Store downloads happen after a user searches, which makes search a critical discovery moment. Search results campaigns let you compete for that intent directly, and because users here are actively searching, benchmarks for conversion rate and CPI are typically strongest in this placement.
Search Tab: broad reach, moderate efficiency
Appearing before a user types a query, Search Tab ads offer prime visibility to help reach audiences early in the discovery funnel. As a result, tap-through rates are lower than in search results, but this placement remains valuable for reaching new audiences.
Today Tab: awareness at scale
The Today Tab is one of the most visible placements on the App Store, offering premium exposure on the front page. Benchmarks typically show higher CPMs alongside lower conversion rates, making this placement best suited for awareness and brand-building.
Product Pages: contextual relevance
Product Page ads appear on the pages of apps similar to yours. While intent is not as strong as in search results, these campaigns can deliver solid conversion rates because they reach users who are already exploring apps in your category. They work well as a complement to search results campaigns.
Expert Tip
In AppTweak’s Campaign Manager, you can benchmark performance across all four placements, helping you understand where each placement fits into your strategy and how costs, conversion rates, and ROAS compare by category and country.Apple Ads cost-per-tap (CPT) benchmarks
The median CPT for search results campaigns across countries and categories is $0.92. Since taps are the first step toward conversion, CPT is an essential metric to measure ad relevance, competitiveness, and overall campaign efficiency.
Below, we focus on CPT benchmarks for search results campaigns.
Apple Ads cost-per-tap by country
The following benchmarks are the median cost per tap (CPT) for search results campaigns.
- U.S.: $1.91
- U.K.: $1.35
- Canada: $1.17
- Australia: $1.15
- Japan: $1.11
- Germany: $1.11
- France: $0.92
Apple Ads cost-per-tap by category (U.S.)
Sports has the highest median CPT in the U.S. at $14.56, well ahead of Finance ($4.17) and Business ($3.33). Shopping ($0.82), Books ($0.88) and Social Networking ($0.90) are the only categories under $1. Games sit at $2.03.
Median CPT by category, U.S. search results, 2025 (~2,800 advertisers tracked by AppTweak)
| Category | Median CPT |
|---|---|
| Sports | $14.56 |
| Finance | $4.17 |
| Business | $3.33 |
| Magazines & Newspapers | $2.85 |
| News | $2.79 |
| Entertainment | $2.42 |
| Games | $2.03 |
| Productivity | $1.74 |
| Health & Fitness | $1.68 |
| Photo & Video | $1.61 |
| Travel | $1.58 |
| Education | $1.52 |
| Utilities | $1.23 |
| Lifestyle | $1.18 |
| Reference | $1.14 |
| Music | $1.14 |
| Weather | $1.05 |
| Navigation | $1.01 |
| Social Networking | $0.90 |
| Books | $0.88 |
| Shopping | $0.82 |
Apple Ads cost-per-tap by campaign type (U.S.)
Competitor campaigns carry the highest CPT for both apps ($3.26) and games ($3.34), and Discovery campaigns the lowest ($1.16 for apps, $0.64 for games).
Median CPT by campaign type, U.S. search results, 2025
| Campaign type | Apps | Games |
|---|---|---|
| Brand | $2.05 | $2.14 |
| Generic | $2.75 | $2.81 |
| Competitor | $3.26 | $3.34 |
| Discovery | $1.16 | $0.64 |
Apple Ads cost-per-install (CPI) benchmarks
The median CPI for search results campaigns across countries and categories is $1.80. Cost-per-install (CPI) is one of the most important Apple Ads benchmarks because it shows how much, on average, you’re paying for each new user. Here we focus on search results campaigns because they capture high-intent users who are already browsing the App Store and actively searching for apps. Since installs are the main conversion event for this ad type, CPI is the most accurate and actionable metric to evaluate performance and compare acquisition costs across categories and markets.
Apple Ads cost-per-install benchmarks by category (U.S.)
Apple Ads cost per install varies by category, which makes category-level benchmarks the right basis for planning. Across U.S. search results campaigns in 2025, median CPI spans from $1.33 for Shopping to $26.70 for Sports. Finance ($9.65) and Business ($6.86) follow Sports. Games sit at $4.63, in the range of mid-tier app categories. Social Networking ($1.45), Books ($1.53) and Weather ($1.86) are among the lowest.
Median CPI by category, U.S. search results, 2025 (~2,800 advertisers tracked by AppTweak)
| Category | Median CPI |
|---|---|
| Sports | $26.70 |
| Finance | $9.65 |
| Business | $6.86 |
| News | $5.86 |
| Entertainment | $4.99 |
| Games | $4.63 |
| Magazines & Newspapers | $4.07 |
| Health & Fitness | $3.77 |
| Travel | $3.70 |
| Productivity | $3.58 |
| Education | $2.91 |
| Photo & Video | $2.79 |
| Lifestyle | $2.62 |
| Utilities | $2.25 |
| Reference | $2.09 |
| Navigation | $1.96 |
| Music | $1.92 |
| Weather | $1.86 |
| Books | $1.53 |
| Social Networking | $1.45 |
| Shopping | $1.33 |
Apple Ads cost-per-install benchmarks by campaign type (U.S.)
For apps, Brand campaigns have a median CPI of $2.84, Generic $5.31 and Competitor $6.78, while Discovery sits at $3.10. For games, the range is wider: from $1.34 for Discovery to $8.69 for Competitor campaigns.
Median CPI by campaign type, U.S. search results, 2025
| Campaign type | Apps | Games |
|---|---|---|
| Brand | $2.84 | $3.73 |
| Generic | $5.31 | $7.84 |
| Competitor | $6.78 | $8.69 |
| Discovery | $3.10 | $1.34 |
Apple Ads cost-per-install benchmarks by country
Cost-per-install benchmarks vary widely by market, reflecting differences in competition, user purchasing power, and overall app demand.
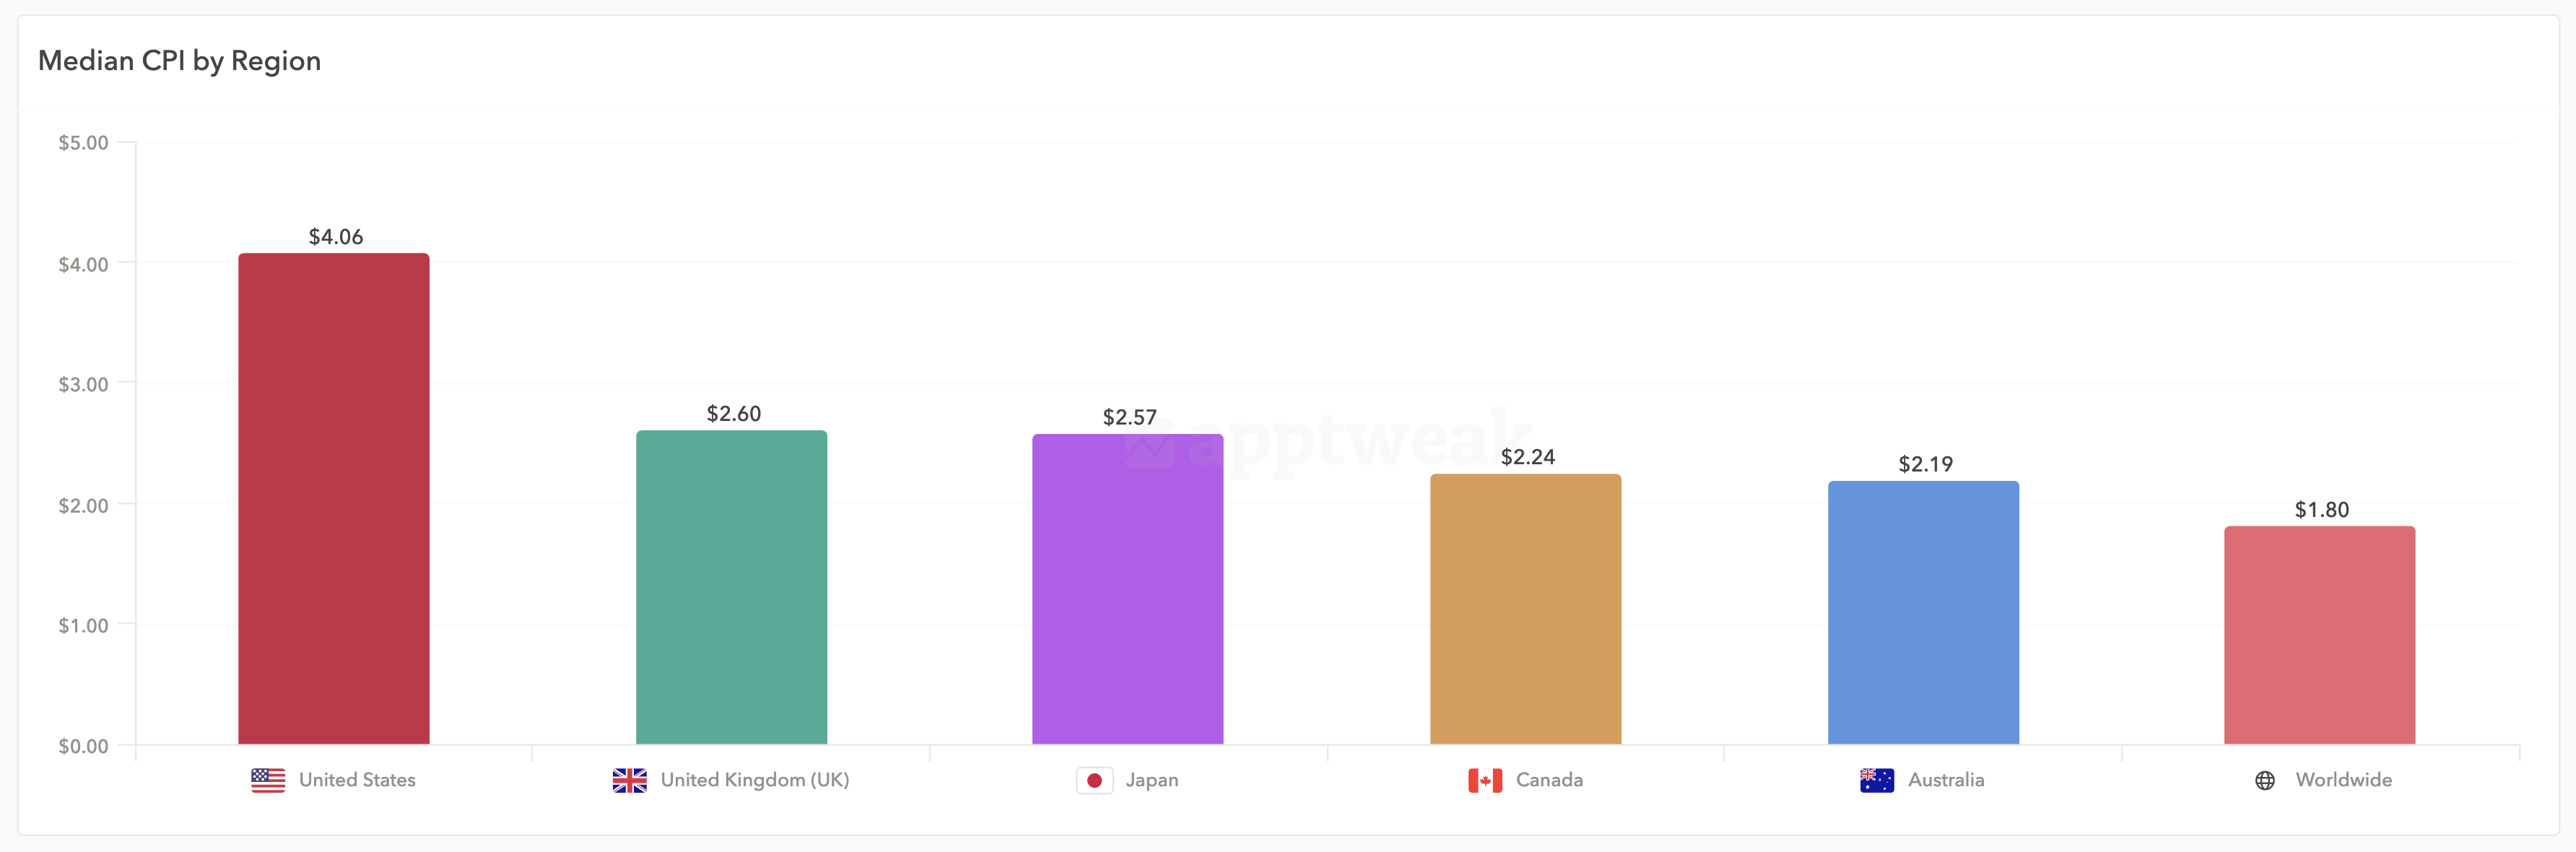
The table below shows median CPI benchmarks for search results campaigns by country, helping you compare acquisition costs across key regions.
| Country | Median cost per install (CPI) |
|---|---|
| Argentina | $0.92 |
| Austria | $1.33 |
| Australia | $2.19 |
| Belgium | $1.47 |
| Brazil | $1.05 |
| Canada | $2.24 |
| Chile | $0.90 |
| Colombia | $0.82 |
| Denmark | $1.36 |
| Finland | $1.27 |
| France | $1.78 |
| Germany | $2.14 |
| India | $0.89 |
| Indonesia | $0.95 |
| Ireland | $1.42 |
| Italy | $1.32 |
| Japan | $2.57 |
| Malaysia | $0.76 |
| Mexico | $1.10 |
| Netherlands | $1.50 |
| Norway | $1.37 |
| New Zealand | $1.31 |
| Philippines | $0.73 |
| Poland | $1.12 |
| Portugal | $1.01 |
| Romania | $1.05 |
| Saudi Arabia | $1.29 |
| Singapore | $1.35 |
| South Africa | $1.02 |
| South Korea | $1.84 |
| Spain | $1.43 |
| Sweden | $1.47 |
| Thailand | $1.10 |
| Turkey | $1.02 |
| United Arab Emirates | $1.38 |
| United States | $4.06 |
| United Kingdom | $2.60 |
| Vietnam | $0.86 |
Cost-per-install benchmarks also highlight clear differences between markets. Countries such as the United States ($4.06), Japan ($2.57), and the United Kingdom ($2.60) show higher CPIs, reflecting strong demand for visibility in mature app markets.
Naturally, emerging markets, including the Philippines ($0.73), Vietnam ($0.86), and Colombia ($0.82), report lower CPIs, while mid-range markets like France ($1.78) and Germany ($2.14) reflect more moderate acquisition costs typical of mature European markets.
Apple Ads cost-per-mille (CPM) benchmarks
Cost-per-mille is particularly useful for understanding the competitiveness of high-visibility placements such as the Today tab or Search tab, where impression volume is high but user intent may vary. The median CPM for today tab campaigns across categories and countries is $3.53.
Apple Ads cost-per-mille by country
The table below shows median CPM benchmarks for different ad placements by country, helping you compare costs across key regions.
Apple Ads cost-per-mille benchmarks by country and ad placement type
| Country | Search Results | Search Tab | Today Tab | Product Pages |
|---|---|---|---|---|
| Argentina | $32.00 | $4.06 | $1.35 | $3.83 |
| Austria | $77.45 | $7.37 | $4.19 | $13.36 |
| Australia | $92.40 | $7.35 | $4.61 | $17.77 |
| Belgium | $64.25 | $5.56 | $3.54 | $9.60 |
| Brazil | $50.09 | $3.29 | $0.74 | $5.30 |
| Canada | $94.99 | $8.55 | $3.93 | $22.29 |
| Chile | $34.96 | $3.58 | $2.49 | $5.37 |
| Colombia | $35.33 | $2.92 | $1.51 | $4.30 |
| Denmark | $60.22 | $6.13 | $2.56 | $9.43 |
| Finland | $56.56 | $5.74 | $1.66 | $8.27 |
| France | $71.20 | $6.45 | $3.06 | $16.97 |
| Germany | $99.57 | $7.86 | $3.66 | $19.78 |
| India | $24.34 | $2.37 | $2.08 | $6.48 |
| Indonesia | $28.59 | $4.33 | $3.84 | $4.17 |
| Ireland | $78.28 | $5.66 | $3.29 | $9.65 |
| Italy | $57.21 | $6.17 | $3.48 | $10.10 |
| Japan | $69.22 | $11.85 | $1.89 | $14.30 |
| Malaysia | $32.93 | $5.32 | $2.10 | $5.55 |
| Mexico | $45.74 | $4.93 | $1.74 | $4.81 |
| Netherlands | $64.72 | $4.33 | $3.21 | $13.24 |
| Norway | $64.61 | $8.83 | $4.94 | $8.93 |
| New Zealand | $65.47 | $5.50 | $5.50 | $11.44 |
| Philippines | $31.22 | $1.98 | $2.99 | $3.17 |
| Poland | $50.66 | $5.31 | $3.00 | $10.10 |
| Portugal | $47.35 | $5.56 | $2.69 | $8.89 |
| Romania | $53.20 | $4.61 | $3.29 | $9.43 |
| Saudi Arabia | $33.36 | $4.78 | $2.48 | $12.30 |
| Singapore | $47.07 | $7.52 | $5.21 | $9.66 |
| South Africa | $50.21 | $6.57 | $4.45 | $5.40 |
| South Korea | $48.11 | $4.93 | $3.99 | $16.75 |
| Spain | $56.69 | $6.48 | $4.72 | $11.62 |
| Sweden | $57.53 | $7.34 | $4.08 | $11.17 |
| Thailand | $29.72 | $5.24 | $1.76 | $5.78 |
| Turkey | $40.78 | $6.69 | $1.67 | $5.70 |
| United Arab Emirates | $61.66 | $6.25 | $4.11 | $16.77 |
| United States | $125.16 | $4.69 | $4.20 | $28.01 |
| United Kingdom | $105.05 | $7.06 | $3.78 | $20.27 |
| Vietnam | $23.42 | $2.66 | $1.44 | $3.90 |
CPM benchmarks are most meaningful in awareness-driven placements such as the Today Tab and Search Tab.
- For example, Japan’s Search Tab CPM ($11.85) is among the highest, while countries like Brazil ($3.29) and Colombia ($2.92) show far lower costs.
- On the Today Tab, Australia ($4.61) and Norway ($4.94) stand out on the higher end, compared to Brazil ($0.74) and Vietnam ($1.44), which remain more cost-efficient.
- Product Page ads typically fall in the mid-range, such as Canada ($22.29) and the United Kingdom ($20.27), offering contextual visibility at moderate CPMs.
Apple Ads conversion rate (CR) benchmarks
The global median conversion rate (CR) for Apple Ads in search results campaigns is 56%, in Search Tab campaigns is 15%, Today Tab campaigns 7.7%, 15% for product pages campaigns, according to AppTweak’s Campaign Manager.
Expert Tip
Consider Apple Ads placements beyond search results for opportunity. Get your benchmarks at AppTweak, which is the only platform on the market providing benchmarks for the average performance of Apple Ads campaigns in all 4 placements (search results, search tab, product page, and today tab).Apple Ads conversion rates by country
The table below shows median CR benchmarks for different ad placements by country.
Apple Ads conversion rate benchmarks by country and ad placement type
| Country | Search Results | Search Tab | Today Tab | Product Pages |
|---|---|---|---|---|
| Argentina | 54% | 9.60% | 6.50% | 15% |
| Austria | 59% | 14% | 11% | 15% |
| Australia | 56% | 18% | 7.70% | 14% |
| Belgium | 58% | 10% | 6.80% | 15% |
| Brazil | 54% | 8.10% | 3.50% | 11% |
| Canada | 56% | 12% | 5.90% | 11% |
| Chile | 59% | 18% | 4.90% | 12% |
| Colombia | 57% | 14% | 4.80% | 14% |
| Denmark | 58% | 24% | 13% | 16% |
| Finland | 57% | 15% | 6.50% | 11% |
| France | 57% | 16% | 9% | 16% |
| Germany | 55% | 12% | 9.10% | 16% |
| India | 48% | 12% | 8.10% | 10% |
| Indonesia | 46% | 32% | 4.90% | 8.50% |
| Ireland | 61% | 15% | 8% | 13% |
| Italy | 56% | 12% | 6.60% | 17% |
| Japan | 46% | 24% | 8.70% | 9.40% |
| Malaysia | 54% | 8.90% | 16% | 10% |
| Mexico | 54% | 13% | 5.90% | 11% |
| Netherlands | 57% | 11% | 7.70% | 14% |
| Norway | 58% | 19% | 15% | 15% |
| New Zealand | 60% | 13% | 9.20% | 13% |
| Philippines | 54% | 7.50% | 3.30% | 16% |
| Poland | 58% | 23% | 17% | 21% |
| Portugal | 59% | 25% | 20% | 16% |
| Romania | 62% | 17% | 19% | 21% |
| Saudi Arabia | 54% | 18% | 9.70% | 15% |
| Singapore | 53% | 14% | 9.40% | 17% |
| South Africa | 59% | 18% | 10% | 11% |
| South Korea | 51% | 19% | 11% | 12% |
| Spain | 55% | 17% | 7.90% | 15% |
| Sweden | 56% | 18% | 11% | 14% |
| Thailand | 48% | 12% | 5.70% | 8.60% |
| Turkey | 48% | 44% | 18% | 11% |
| United Arab Emirates | 60% | 21% | 19% | 7% |
| United States | 55% | 15% | 5.20% | 16% |
| United Kingdom | 57% | 17% | 7.60% | 14% |
| Vietnam | 49% | 19% | 7.80% | 14% |
If you’re planning to run campaigns across multiple markets, we highly recommend you check out our guide to app store localization, which has tips for Apple Ads and Google Play platforms.
Apple Ads conversion rates by category (U.S.)
Median tap-to-install conversion rate ranges from about 50% to 67.5% across U.S. categories. Photo & Video (67.5%), Social Networking (65.3%) and Magazines & Newspapers (64.6%) convert best; Health & Fitness (50.3%), Travel (50.5%) and Finance (50.7%) convert least. Sports combines a high CR (63.8%) with the highest median CPT.
Median CR by category, U.S. search results, 2025
| Category | Median CR |
|---|---|
| Photo & Video | 67.5% |
| Social Networking | 65.3% |
| Magazines & Newspapers | 64.6% |
| Sports | 63.8% |
| Utilities | 63.2% |
| Games | 61.8% |
| Music | 61.4% |
| Weather | 60.9% |
| Shopping | 58.9% |
| Entertainment | 57.9% |
| Navigation | 57.9% |
| Books | 57.9% |
| Reference | 57.5% |
| Productivity | 56.5% |
| Education | 56.4% |
| Business | 55.6% |
| Lifestyle | 54.8% |
| News | 50.8% |
| Finance | 50.7% |
| Travel | 50.5% |
| Health & Fitness | 50.3% |
Apple Ads tap-through rate and conversion rate by campaign type (U.S.)
Brand campaigns show by far the highest engagement: for apps, a TTR of 25.3% and a CR of 73.5%; for games, 25.5% and 70.5%. Generic campaigns follow (apps: TTR 8.5%, CR 59.8%). Competitor and Discovery campaigns reach users with lower intent, which shows in their TTR (3.8% and 4.2% for apps) and CR (50.1% and 44.5%).
Median TTR and CR by campaign type, U.S. search results, 2025
| Campaign type | Apps TTR | Apps CR | Games TTR | Games CR |
|---|---|---|---|---|
| Brand | 25.3% | 73.5% | 25.5% | 70.5% |
| Generic | 8.5% | 59.8% | 6.3% | 59.9% |
| Competitor | 3.8% | 50.1% | 4.1% | 55.4% |
| Discovery | 4.2% | 44.5% | 6.4% | 53.7% |
Want to learn more about the different Apple Ads campaign types? Read our ultimate guide to Apple Ads.
Apple Ads tap-through rate (TTR) benchmarks
Below you’ll find the Apple Ads tap-through rate benchmarks by ad placement and country.
Apple Ads tap-through rate benchmarks by ad placement
Tap-through rate varies significantly across Apple Ads placements. The table below shows global median TTR benchmarks for search results, Search Tab, Today Tab, and Product Pages, highlighting how user intent influences engagement.
Apple Ads tap-through-rate benchmarks by ad placement (global)
| Placement | Median tap-through rate |
|---|---|
| Search Results | 7.40% |
| Search Tab | 0.29% |
| Today Tab | 0.32% |
| Product Page | 2.00% |
Search results campaigns consistently drive the highest TTR worldwide, reflecting strong user intent. Today Tab and Search Tab ads are designed to drive awareness and discovery, with TTRs reflecting their upper-funnel role.
Apple Ads tap-through-rate benchmarks by country
Since most installs are driven by search results campaigns, TTR by country is typically measured in this placement. The table below shows search results TTR benchmarks across top markets, allowing you to compare performance by region.
Apple Ads tap-through rate benchmarks by country, search results
| Country | Median tap-through rate |
|---|---|
| Argentina | 6.90% |
| Austria | 10.00% |
| Australia | 7.80% |
| Belgium | 7.20% |
| Brazil | 9.20% |
| Canada | 7.60% |
| Chile | 8.20% |
| Colombia | 7.90% |
| Denmark | 8.40% |
| Finland | 8.40% |
| France | 7.40% |
| Germany | 8.60% |
| India | 5.20% |
| Indonesia | 6.20% |
| Ireland | 8.30% |
| Italy | 8.10% |
| Japan | 6.40% |
| Malaysia | 7.30% |
| Mexico | 7.90% |
| Netherlands | 7.60% |
| Norway | 7.60% |
| New Zealand | 8.40% |
| Philippines | 7.80% |
| Poland | 7.90% |
| Portugal | 8.70% |
| Romania | 9.60% |
| Saudi Arabia | 5.50% |
| Singapore | 6.90% |
| South Africa | 9.80% |
| South Korea | 6.30% |
| Spain | 7.20% |
| Sweden | 7.70% |
| Thailand | 6.60% |
| Turkey | 9.20% |
| United Arab Emirates | 7.70% |
| United States | 6.60% |
| United Kingdom | 7.20% |
| Vietnam | 5.60% |
Tap-through rates in search results campaigns show meaningful variation by market. Countries like Austria (10%), Romania (9.6%), and South Africa (9.8%) stand out with some of the highest engagement rates, well above the global median.
In contrast, markets such as India (5.2%), Vietnam (5.6%), and Saudi Arabia (5.5%) report lower TTRs, highlighting the importance of adjusting expectations (and creative strategies) based on regional benchmarks.
Apple Ads tap-through-rate benchmarks by category (U.S.)
Shopping (12.3%) and Photo & Video (11.5%) have the highest median TTR in U.S. search results, followed by Utilities (10.6%). News has the lowest at 3.0%, followed by Travel (4.7%), Finance (5.6%) and Sports (5.8%).
Median TTR by category, U.S. search results, 2025
| Category | Median TTR |
|---|---|
| Shopping | 12.3% |
| Photo & Video | 11.5% |
| Utilities | 10.6% |
| Magazines & Newspapers | 10.1% |
| Reference | 9.8% |
| Games | 9.3% |
| Music | 9.0% |
| Weather | 8.9% |
| Social Networking | 8.5% |
| Productivity | 8.3% |
| Education | 8.3% |
| Business | 7.8% |
| Entertainment | 7.6% |
| Books | 7.6% |
| Health & Fitness | 7.5% |
| Lifestyle | 7.4% |
| Navigation | 7.3% |
| Sports | 5.8% |
| Finance | 5.6% |
| Travel | 4.7% |
| News | 3.0% |
Apple Ads custom product page benchmarks
A custom product page (CPP) is an alternative App Store product page that can be used as the landing page of an Apple Ads ad. Most U.S. advertisers still do not use them: 61% of apps and 74% of games ran no custom product pages in Apple Ads in 2025. Only 20% of apps and 7% of games used custom product pages more than 5 times in the year (~2,800 U.S. advertisers tracked by AppTweak).
How custom product pages affect conversion
Custom product pages lift tap-to-install conversion rate rather than tap-through rate. Apps using a CPP convert taps to installs at 58.7% versus 55.5% on the default page, a 3.2 percentage point gain. Games gain 2.8 points (56.8% versus 54.0%). The gain happens after the tap: TTR barely moves.
Default product page vs custom product pages, U.S. Apple Ads, 2025
| Metric | Apps default | Apps with CPP | Games default | Games with CPP |
|---|---|---|---|---|
| CR | 55.5% | 58.7% (+3.2 pt) | 54.0% | 56.8% (+2.8 pt) |
| ITI | 9.6% | 9.8% (+0.2 pt) | 8.2% | 9.0% (+0.8 pt) |
| TTR | 14.7% | 14.3% (-0.3 pt) | 13.7% | 14.1% (+0.4 pt) |
Custom product page adoption by campaign type
Among U.S. app advertisers, Generic campaigns have the highest CPP adoption at 30.7%, followed by Competitor (28.6%) and Brand (27.1%). Discovery campaigns lag at 13.8%.
Custom product page adoption by category
CPP adoption ranges from 13.0% to 38.5% across U.S. app categories. News (38.5%), Weather (33.3%) and Sports (33.2%) lead, categories where creative relevance to a moment, a season or a search intent matters. Games sit at 23.2%. By volume, Photo & Video apps run the most custom product pages (8.3 per year on average), followed by Health & Fitness (6.8) and Education (5.8); among games, Casino leads at 6.5.
Share of Apple Ads campaigns using a CPP, by category, U.S., 2025
| Category | CPP adoption |
|---|---|
| News | 38.5% |
| Weather | 33.3% |
| Sports | 33.2% |
| Shopping | 31.7% |
| Photo & Video | 29.4% |
| Travel | 28.9% |
| Reference | 25.9% |
| Business | 25.6% |
| Finance | 24.4% |
| Games | 23.2% |
| Utilities | 22.8% |
| Health & Fitness | 21.2% |
| Music | 21.2% |
| Productivity | 19.0% |
| Lifestyle | 18.3% |
| Entertainment | 17.3% |
| Navigation | 16.9% |
| Books | 15.0% |
| Magazines & Newspapers | 14.2% |
| Education | 13.5% |
| Social Networking | 13.0% |
Apple Ads seasonality: when CPT rises and falls
CPT follows the same seasonal pattern across all campaign types in the U.S.: it runs below the annual baseline through Q1 and rises toward the holiday season. Generic campaigns peak furthest above their own baseline, at +8.8% in November, and Competitor and Discovery campaigns end the year about 6% above theirs. Brand campaigns behave differently: they peak in September (+2.7%) and fall to 8.7% below baseline in December.
Each advertiser is compared with its own yearly average CPT, so the index shows seasonality independently of price levels and of which advertisers were active each month. Only app advertisers active at least six months are included, combined with a volume-weighted average.
Monthly CPT vs each advertiser’s annual average, by campaign type, U.S. app advertisers, 2025
| Month | Brand | Generic | Competitor | Discovery |
|---|---|---|---|---|
| January | -11.8% | -10.3% | -9.0% | -10.0% |
| February | -3.3% | -9.2% | -7.7% | -10.7% |
| March | -4.8% | -8.4% | -7.7% | -8.3% |
| April | -5.4% | -7.3% | -8.4% | -6.5% |
| May | 0.0% | -0.6% | -0.9% | +0.9% |
| June | -5.4% | -4.0% | -2.0% | +3.1% |
| July | -2.0% | -1.4% | -3.1% | -1.0% |
| August | +0.6% | -3.2% | -1.2% | -1.0% |
| September | +2.7% | +1.6% | +3.0% | +2.7% |
| October | -3.2% | +5.9% | +3.2% | +5.5% |
| November | -3.1% | +8.8% | +5.9% | +4.2% |
| December | -8.7% | +8.4% | +6.0% | +5.7% |
For planning, this means Q1 is the cheapest window to scale Generic and Competitor campaigns, and Q4 budgets for those campaigns need headroom for CPT roughly 6% to 9% above the yearly average.
ROAS and CPA trends
As Apple Ads matures, advertisers are moving beyond surface-level metrics like cost per tap or tap-through rate and focusing more on profitability benchmarks such as return on ad spend (ROAS).
While many marketers also track cost per acquisition, in this guide, we use cost per install as a standardized proxy. Cost per install represents the acquisition cost at the install level, while CPA may also include deeper in-app events such as purchases or subscriptions, typically tracked via MMP integrations.
Here are the 4 key trends shaping ROAS and CPI in 2026:
- Search results provide strong ROAS. High-intent searches often deliver the most efficient return on ad spend. Marketers should make search results a key reference point for ROAS benchmarks, where user intent is strongest.
- Competitor campaigns show varied ROAS. While bidding on competitor keywords often leads to higher CPIs, these campaigns can still play a role in winning market share and attracting new audiences. They should be measured with expectations that reflect their exploratory nature.
- Custom product pages lift conversion. In the U.S., apps using a custom product page convert 3.2 points more taps into installs than on the default page (58.7% vs 55.5%, 2025). Tailored pages are a conversion lever; measure their downstream effect on CPI and ROAS in your own account.
- Shift towards outcome-based optimization. With MMP integrations, more advertisers are moving from optimizing for installs (CPI) to optimizing for in-app events and ROAS. Campaign Manager automates this process, making it easier to tie bids to revenue-driving actions.
Together, these trends show that ROAS is becoming the north star metric for Apple Ads in 2026. CPI remains the most standardized proxy for acquisition costs, but ROAS reveals the true profitability of campaigns.
How to measure Apple Ads performance effectively
Measuring Apple Ads performance is about more than tracking a single metric. It’s important to utilize the right platforms and data sources to monitor your campaigns. Let’s review the tools needed to measure Apple Ads performance.
Native Apple Ads reporting
Apple Ads’ native reporting provides essential real-time campaign data: impressions, taps, tap-through rate, cost-per-tap, and tap-to-install conversion rate. This makes it a great tool for day-to-day optimizations, such as adjusting bids or reallocating budget when certain keywords underperform.
Third-party tools
App marketers also like to use third-party tools to contextualize performance data.
They help advertisers:
- Benchmark results against competitors and category averages
- Combine Apple Ads performance with other marketing signals, such as ASO or MMP data
- Automate campaign management and scale efficiently across countries or large keyword sets
AppTweak’s Campaign Manager for Apple Ads
While some platforms focus on a single piece of the puzzle, AppTweak’s Campaign Manager integrates Apple Ads data, App Store Optimization (ASO) insights, competitor intelligence, and Mobile Measurement Partner (MMP) integrations in one place. This provides advertisers with a 360° view of acquisition performance.
With Campaign Manager, app marketers can:
- Uncover new growth opportunities. Expand beyond brand keywords with AppTweak’s keyword discovery tools, while tracking impression share to benchmark against competitors in your category.
- Optimize campaigns with confidence. Set up automation rules to adjust bids, pause underperformers, or reallocate budget in real time, ensuring spend is always aligned with your goals.
- Measure what really matters. Integrate with MMPs like Adjust or AppsFlyer to connect Apple Ads campaigns to downstream events such as retention, subscriptions, or in-app purchases.
- Save time at scale. Leverage bulk editing, smart bidding, and customizable dashboards to cut manual work and focus on strategy.
With this holistic approach, AppTweak’s Campaign Manager helps advertisers not only analyze and optimize Apple Ads but also connect paid and organic strategies, making it easier to drive profitable, sustainable app growth.
Mobile Measurement Partners (MMPs)
MMPs such as Adjust or Appsflyer extend measurement beyond the install. They provide insight into retention, in-app purchases, and subscriptions, allowing advertisers to optimize for long-term value instead of just installs. AppTweak integrates with MMPs, meaning you can connect in-app event data with Campaign Manager’s automation rules, optimizing campaigns not just for cost-per-install (CPI), but for return on ad spend (ROAS) and lifetime value (LTV).
Other considerations: SKAdNetwork 4.0
Apple’s SKAdNetwork 4.0 plays a role in post-install attribution by offering longer measurement windows and more granular conversion values. While it isn’t a tool you “use” directly, advertisers should ensure their event mapping and MMP integration are correctly set up to take advantage of SKAN’s improvements.
Best practices for interpreting Apple Ads benchmarks
Apple Ads benchmarks are powerful tools, but it’s important to interpret them with context. Here’s how to use them effectively.
- Compare within your category. Benchmarks for gaming apps look very different from finance or lifestyle. Comparing across categories could lead to misleading conclusions.
- Account for seasonality. Metrics like cost per install and tap-through rate fluctuate around key moments such as Black Friday, back-to-school, or new device launches. A spike in costs during Q4 doesn’t necessarily indicate poor performance: it often reflects heightened competition. In AppTweak’s U.S. data, CPT runs up to about 12% below each advertiser’s annual average in January and up to 8.8% above it in November for Generic campaigns (see the Apple Ads seasonality section above).
- Look for opportunities, not just validation. If your app’s cost per tap is slightly above category benchmarks but your conversion rate is higher, you may still be acquiring users efficiently. Benchmarks should guide where you can improve visibility or creative relevance, not just confirm results.
- Factor in app maturity. New apps often face higher cost per install while building awareness. Established apps are likely more able to afford higher acquisition costs because of strong downstream monetization. Always assess benchmarks relative to your growth stage and retention model.
AppTweak’s view on Apple Ads trends for 2026
Here are the top Apple Ads trends we’re seeing in 2026, based on AppTweak’s data and partner insights.
Additional ads in search results
Apple Ads introduced additional ads in App Store search results in March 2026, expanding the inventory available to advertisers in the search results placement. AppTweak compared U.S. app advertisers’ performance in the 28 days before and the 28 days after the rollout (March 25, 2026).
Reach increased across all campaign types, and Discovery campaigns saw the largest gains: impressions up 44.9%, taps up 41.6% and installs up 35.8%. Generic campaigns saw impressions up 19.4% and installs up 8.1%; Brand campaigns, impressions up 6.2% and installs up 5.5%.
Costs stayed broadly stable. CPT declined for Brand (-4.4%), Generic (-5.6%) and Competitor (-5.5%) campaigns. CPI fell modestly for Brand (-2.6%) and Generic (-3.8%), moved marginally for Competitor (-1.7%) and rose for Discovery (+4.3%).
Change in reach and cost, 28 days after vs 28 days before March 25, 2026 (U.S. app advertisers, search results)
| Campaign type | Impressions | Taps | Installs | CPT | CPI |
|---|---|---|---|---|---|
| Brand | +6.2% | +8.1% | +5.5% | -4.4% | -2.6% |
| Generic | +19.4% | +10.1% | +8.1% | -5.6% | -3.8% |
| Competitor | +9.5% | +12.8% | +6.4% | -5.5% | -1.7% |
| Discovery | +44.9% | +41.6% | +35.8% | -1.9% | +4.3% |
The implication for campaign structure: Discovery campaigns captured most of the new reach, so review search terms from Discovery more often and promote proven keywords to exact-match campaigns, and keep monitoring impression share on Brand campaigns.
Creative assets change what users see before they tap
Apple introduced Creative Assets at WWDC 2026: rich images and videos that appear in the product page header and in organic keyword search results, managed independently of app version releases through the Asset Library in App Store Connect. Note that Creative Assets are expected to be available fall 2026.
For Apple Ads campaigns, Creative Assets work across both organic placements and paid ads from the same library. An asset built for a custom product page can now serve across organic search results, paid placements, and Product Page Optimization tests, making alignment between paid and organic teams more valuable than before.
The more immediate opportunity is relevance: for the first time, the visual a user sees when they search a relevant keyword can be tailored to that context, rather than defaulting to whatever Apple pulls from your main product page screenshots. Teams that treat creatives as a set-once decision will leave tap-through rate and tap-to-install conversion rate on the table.
Discovery is expanding beyond the search bar
Apple’s Personalized Collections introduce an algorithmic recommendation layer in the App Store that surfaces apps based on each user’s interests, app usage, and downloads, across the Apps, Games, and Search tabs, before a user searches at all. This adds a discovery surface alongside keyword search and top charts, rather than replacing them. Personalized Collections is currently available in select countries and regions for a limited number of apps, with broader expansion planned over time.
For Apple Ads practitioners, the implication is strategic: the same inputs that support strong search performance, clear category fit, precise keyword relevance, and strong conversion signals, are the ones that help AI-driven systems understand and surface your app. We believe teams that invest in ASO fundamentals and keyword strategy are better positioned across both paid and organic discovery as this layer scales.
Keyword search remains the highest-intent placement on the App Store, and search results campaigns continue to deliver the strongest tap-to-install conversion rates in our data. What’s shifting is how much of the discovery phase happens before someone types a query, and that share is growing.
Automation for discovery and scale
Automation continues to play a central role in how advertisers structure campaigns efficiently. A strong practice is to use Search Match and broad match in dedicated discovery ad groups, then promote proven keywords to exact match campaigns for tighter control. This keeps discovery running without diluting performance data.
To maintain efficiency as you scale, pair this structure with rule-based optimization. Campaign Manager for Apple Ads helps advertisers automate these workflows, surfacing keyword opportunities, applying smart bidding rules, and supporting optimization toward ROAS at scale, so teams can focus on strategy rather than repetitive campaign management tasks.
Case study: How SoundCloud achieved 190% ROAS
SoundCloud, the world’s largest music and audio platform, relies heavily on the App Store as its primary acquisition channel, with 75% of its downloads driven by search. Despite this strong organic foundation, the brand’s Apple Ads campaigns struggled to scale. Daily budgets were consistently underutilized, with spend capped at only 56%.
Challenge: Find new keyword opportunities
The challenge was clear: SoundCloud needed to unlock new keyword opportunities and optimize campaign efficiency to maximize reach and profitability.
Solution: Use AppTweak to find top keywords
To address this, SoundCloud partnered with AppTweak’s App Growth Consultants and Data Science team, who implemented a structured, multi-step approach. Using Atlas AI, AppTweak’s proprietary language model, the SoundCloud team identified thousands of highly relevant keywords and clustered them into a dedicated discovery campaign.
By systematically migrating high-performing keywords into performance campaigns with tailored bids, and using negative keywords to avoid overlap, SoundCloud expanded reach while maintaining tighter budget control. This disciplined structure was key to balancing discovery and efficiency.
Made custom product pages part of the strategy
Custom product pages and outcome-based optimization rounded out the strategy. SoundCloud deployed CPPs in category and competitor campaigns, which improved conversion rates by 58%. At the same time, automation rules and ROAS-driven bidding allowed them to align spend with long-term value goals.
The results were striking:
- Installs from non-brand keywords grew 4x
- Budget utilization tripled
- ROAS on non-branded campaigns increased by 190%.
Over one year, SoundCloud tripled its Apple Ads ad spend while increasing ROAS on non-branded keywords 190%.
This case study highlights how combining AppTweak’s automation, keyword intelligence, and creative optimization can turn underperforming Apple Ads campaigns into sustainable engines for growth.
Conclusion
AppTweak’s Apple Ads benchmarks give app marketers the context they need to evaluate performance and make informed, data-driven decisions. By looking at costs, conversion rates, tap-through rates, markets and placements, advertisers can set realistic goals and uncover areas of opportunity.
The 2025 data shows that efficiency varies meaningfully by vertical and region, and that each placement on the App Store plays a different role in the user journey. Custom product pages, automation, and structured discovery remain important levers for improving performance, while outcome-based measurement continues to gain traction.
With the right tools, such as AppTweak’s Campaign Manager for Apple Ads, marketers can benchmark against competitors, connect performance with downstream events, and automate optimizations to stay aligned with their growth objectives. Want to see the Apple Ads benchmarks that matter most for your app? Explore AppTweak now with a free trial.
The U.S. data adds two planning inputs: campaign type matters as much as category (Competitor CPI is more than twice Brand CPI for apps), and timing matters, with Generic CPT about 9% above its annual average in November. For the organic ASO benchmarks that complement these figures, download the ASO and Apple Ads trends and benchmarks report 2026.
FAQs
What is a good conversion rate for Apple Ads?
In U.S. search results, median tap-to-install conversion rate ranges from about 50% to 67.5% by category (AppTweak, ~2,800 advertisers, 2025), and Brand campaigns reach 73.5% for apps. A CR above 60% is strong for most categories; compare against your own category and campaign type.
How much do Apple Ads cost?
Apple Ads charges per tap in search results. The global median CPT is about $0.92 and the global median CPI about $1.80 (AppTweak Campaign Manager benchmark, 38 countries, 2025). In the U.S., median CPI ranges from $1.33 (Shopping) to $26.70 (Sports).
What is the average CPI for Apple Ads?
The global median CPI for search results is about $1.80 and the U.S. median is $4.06 (Campaign Manager benchmark, 2025). By U.S. category, median CPI ranges from $1.33 for Shopping to $26.70 for Sports, with Games at $4.63 (report, ~2,800 U.S. advertisers, 2025).
What is the average CPT for Apple Ads?
The global median CPT is about $0.92 and the U.S. median $1.91 (Campaign Manager benchmark, 2025). By U.S. category, median CPT ranges from $0.82 for Shopping to $14.56 for Sports, and Finance exceeds $4.
What is the average CPA for Apple Ads?
AppTweak benchmarks cost-per-install (CPI) as the standardized proxy for CPA, since CPA varies by app business model. The global median CPI for search results campaigns is $1.80, ranging from under $1 in some emerging markets to $26.70 for Sports apps in the U.S. (2025).
How do custom product pages impact Apple Ads conversions?
In the U.S. in 2025, apps using custom product pages in Apple Ads converted 58.7% of taps into installs versus 55.5% on the default page (+3.2 points), and games 56.8% versus 54.0% (+2.8 points), according to AppTweak’s analysis of ~2,800 advertisers.
How do I compare Apple Ads performance by category?
Compare within your category, because the spread is wide: in the U.S., median CPI is $4.63 for Games, $1.92 for Music and $26.70 for Sports (AppTweak, 2025). AppTweak Campaign Manager provides category-level benchmarks for CPT, CPI, CR and TTR.
How do I measure ROAS for Apple Ads?
ROAS for Apple Ads is calculated by dividing campaign revenue by total ad spend. According to AppTweak data, non-brand campaigns optimized with outcome-based bidding and custom product pages can achieve significant ROAS improvements, with some advertisers seeing lifts of up to 190% (see SoundCloud case study). Use post-install event data from your MMP to capture full revenue in AppTweak’s Campaign Manager.
How can I improve TTR and CPA in Apple Ads?
Use high-intent keywords, refine match types and align ads with custom product pages by query. In the U.S., Shopping and Photo & Video show the highest median TTR (12.3% and 11.5%), and Photo & Video the highest CR (67.5%) (AppTweak, 2025).
When are Apple Ads costs highest during the year?
In the U.S., CPT is lowest in Q1 and highest in Q4. Generic campaigns peak at +8.8% above each advertiser’s annual average CPT in November, while Brand campaigns peak in September (+2.7%) and drop in December (AppTweak, U.S. app advertisers, 2025).
What are Discovery campaign benchmarks for Apple Ads?
In U.S. search results in 2025, Discovery campaigns had a median CPI of $3.10 and CPT of $1.16 for apps, and $1.34 and $0.64 for games, with a CR of 44.5% for apps and 53.7% for games (AppTweak, ~2,800 advertisers).
How did additional search results ads affect Apple Ads?
In the 28 days after Apple Ads introduced additional ads in search results (March 25, 2026), U.S. app advertisers’ Discovery campaigns saw impressions rise 44.9% and installs 35.8%, while CPT fell 4.4% to 5.6% for Brand, Generic and Competitor campaigns, compared with the 28 days before (AppTweak).


 Sukanya Sur
More articles in App Market Insights, Apple Ads

 Micah Motta


