With user acquisition (UA), the relationship is direct and immediate. You spend a defined budget, acquire installs, and calculate return based on cost per install, revenue, or ROAS. The inputs and outputs are clearly linked.
ASO does not work that way. There is no fixed spend tied to each install, and its impact is indirect. Improvements in keywords, visuals, or ratings influence visibility and conversion over time, across both organic and paid traffic. This makes ASO ROI harder to isolate because growth is influenced by multiple factors such as app store dynamics, seasonality, brand demand, and paid campaigns.
ASO impact and business impact are not the same thing. ASO impact refers to improvements in store performance such as higher keyword rankings, more impressions, or better conversion rates. These explain what is changing. Business impact is what those changes actually generate in terms of installs, revenue, or acquisition cost savings.
This guide will give you practical frameworks, metrics, and reporting methods to confidently measure and communicate ASO impact.
- ASO ROI measures the business value generated by ASO—through installs, revenue, or cost savings—relative to the total cost of ASO efforts, not store performance metrics alone
- ASO impact and business impact must be separated: rankings, impressions, and conversion rate explain performance, while ROI is defined by incremental installs, revenue, or paid acquisition savings
- ASO ROI is indirect and compounding, as improvements in visibility and conversion generate long-term value across both organic growth and paid acquisition efficiency
- Measuring ASO ROI requires estimating incremental installs driven by ASO, calculating total ASO costs, and applying either an LTV-based revenue model or a CPI-based cost-savings model
- Reliable ROI measurement depends on incrementality analysis, using methods like A/B testing, holdouts, or time-series modeling to isolate what would not have happened without ASO
- ASO shows early signals within weeks, but reliable ROI measurement typically requires 1 to 3 months of data to account for seasonality, baselines, and external factors
What does ROI mean in app store optimization?
ASO ROI is the business value from acquisitions attributable to ASO divided by the cost of ASO efforts.
It is important to separate ASO metrics from business outcomes. Rankings, impressions, and conversion rate help explain performance, but ROI is about what they generate such as installs, revenue, or acquisition efficiency.
ASO ROI also compounds over time. Improvements in visibility and conversion continue to generate value over time not just when the optimization was done, unlike paid campaigns that stop when spending stops. This value extends across both organic growth and paid performance, making ASO an acquisition efficiency lever across your entire growth strategy.
What metrics matter to measure ASO ROI?
ASO performance metrics explain why ROI changes, but they are not ROI themselves.
ASO input metrics (diagnostic)
These help you understand what is driving performance:
- Keyword rankings
- Impressions
- Conversion rate
ASO outcome metrics (ROI-linked)
These are directly tied to business impact
- Incremental organic installs
- LTV-driven incremental revenue
- Paid UA cost savings measured through CPI
A strong measurement should connect both diagnostic and outcome metrics to tell a complete ROI story.
How do you calculate ASO ROI?
There is no universal ASO ROI formula. Teams estimate the value generated by ASO and compare it to its cost.
This involves three steps:
- Estimate the installs generated by ASO
- Calculate ASO costs
- Predict the ASO Business Value using one of these methods (paid UA cost savings, revenue-based from LTV)
Step 1: Estimate the installs generated by ASO
To estimate ASO-driven installs, break total organic installs into three components: non-brand search installs, event-driven installs, and incremental lift from creative updates.
- Non-brand search installs: brand searches are classified as organic, but they are not directly controlled by ASO. To estimate non-brand installs, apply the share of non-brand keywords to your total organic search installs. Tools like AppTweak’s All Ranked Keywords can help you determine this share across your keyword pool.
- Installs from event-driven efforts: this includes traffic generated by in-app events and promotional content, which can contribute to ASO performance but should be tracked separately.
- Incremental uplift from creative updates: this is measured by aggregating the incremental impact of each creative change made throughout the year, such as updates to icons, screenshots, or videos. Using AppTweak’s Incrementality Analysis tool allows you to quantify the uplift from each update and combine them into a total ASO contribution.
| App A | Total Installs 2025 | Total Organic Installs | Organic Search Installs | Non-Brand Search (30%) | All Events Installs | Incremental Uplift All Creative Updates |
| 1,600,000 | 1,200,000 | 800,000 | 240,000 | 20,000 | 90,000 | |
| Total ASO-generated installs annually: 350,000 | ||||||
Step 2: Calculate ASO costs
ASO costs typically include the resources required to plan, execute, and measure your optimization efforts.
These ASO costs can include:
- Creative production and localization, whether handled in-house or through external partners
- Tools and platforms used for ASO research, monitoring, and analysis
- Human resources, such as ASO managers, designers, or support from agencies and freelancers
It is important to note that cost structures vary significantly from one company to another. Depending on team size, level of outsourcing, and internal capabilities, each app will have a different way of allocating and calculating ASO costs. Capturing these costs accurately is essential to ensure your ROI calculations reflect the true investment behind your ASO strategy.
Step 3: Predict the ASO business value using one of these methods
These models quantify ASO’s business impact and evaluate it against your total investment to determine ROI.
Model 1: Revenue-based ASO ROI
This formula calculates ROI based on the revenue generated by ASO-driven installs.
ASO ROI (%) = ((ASO installs × LTV)−ASO Costs)/ASO Costs x 100
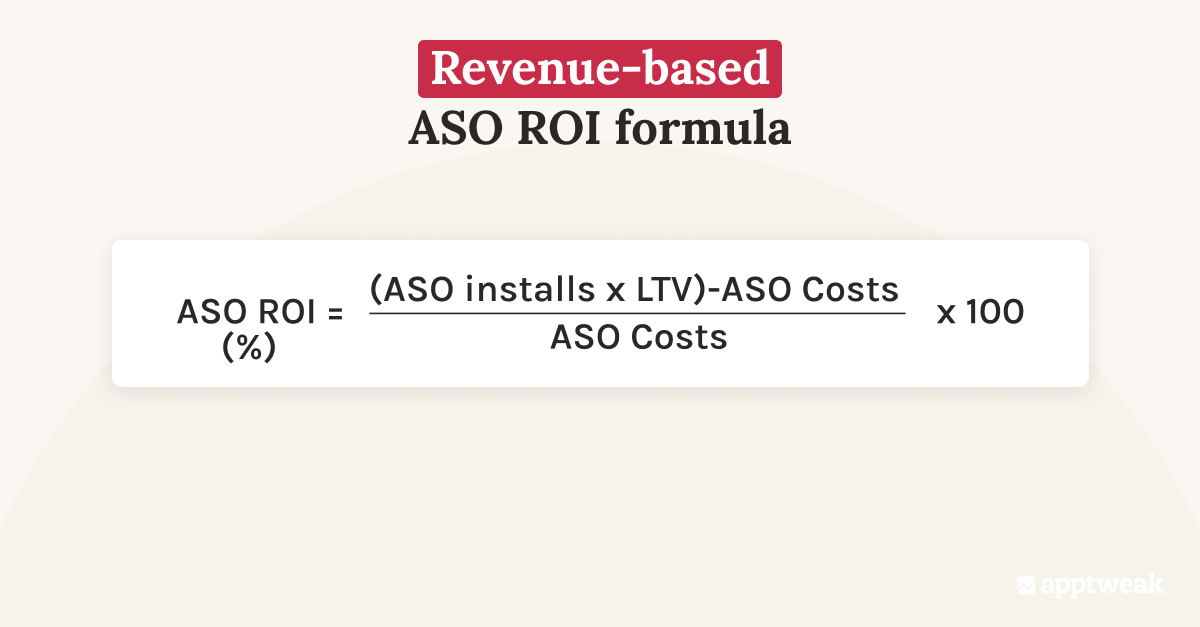
This model gives insight on whether or not ASO is actually profitable.
Best for subscription apps and teams with strong monetization data. It works particularly well when you have reliable LTV estimates and a clear understanding of how installs translate into revenue over time.
It is especially useful for presenting to finance, growth leadership, and CMOs, as it translates ASO performance into a familiar business metric: return on investment.
However, this revenue-based approach requires solid data foundations. Without accurate LTV or revenue attribution, the results can quickly become misleading, so this approach is best suited for more mature apps with established monetization models.
Model 2: Paid UA cost savings-based ASO ROI (CPI offset)
This formula calculates ASO ROI based on the cost savings generated by ASO-driven installs compared to paid acquisition.
ASO ROI (%) = ((ASO installs x average paid CPI)−ASO Costs)/ASO Costs x 100
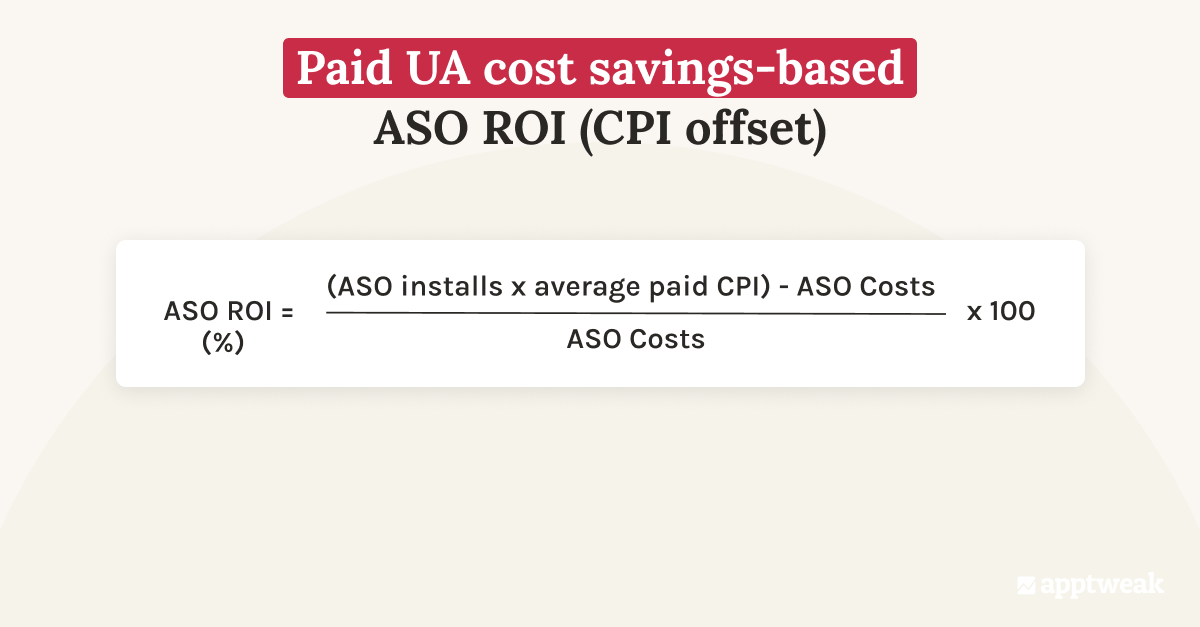
Best suited for teams focused on acquisition efficiency and budget optimization, particularly when reliable CPI benchmarks are available.
It is particularly strong for alignment with growth and UA teams, since it connects organic performance directly to paid acquisition strategy. In many cases, this makes it the most actionable model for decision-making.
However, this CPI-based approach is still a proxy for value, not actual value. It assumes that every incremental organic install replaces a paid one at the same CPI, which is not always true. CPI can fluctuate, and not all organic installs would have been acquired through paid channels. This means the model can overestimate savings if incrementality is not carefully measured.
In practice, this model works best when used alongside incrementality analysis and supported by stable CPI benchmarks. It is excellent for communicating efficiency, but less precise for measuring true profitability compared to revenue-based models.
How to calculate ASO ROI: a real example
To illustrate how ASO ROI is calculated, let’s apply both the revenue-based and CPI-based models introduced above to the same scenario
- ASO installs = 10,000
- Paid CPI = €2
- LTV = €3
- ASO costs = €8,000
Model 1 (Revenue-based ROI)
ASO ROI = (ASO installs × LTV − ASO costs) / ASO costs
= (10,000 × 3 – 8,000) / 8,000
= (30,000 − 8,000) / 8,000
= 22,000 / 8,000
= 2.75 → 275%
👉 Interpretation; Real profitability based on user value.
Model 2 (CPI-based ROI)
ASO ROI = (ASO installs × paid CPI − ASO costs) / ASO costs
= (10,000 × 2 − 8,000) / 8,000
= (20,000 − 8,000) / 8,000
= 12,000 / 8,000
= 1.5 → 150%
👉 Interpretation:
Efficiency vs paid acquisition (cost-saving view).
Which ASO ROI measurement model should I use?
| Revenue-based (LTV) | Cost-efficiency (CPI offset) | |
|---|---|---|
| Best for | Subscription apps, mature monetization | Any app, early-stage to enterprise |
| Data needed | LTV estimates, install attribution | Paid CPI benchmarks, organic installs |
| Leadership appeal | Finance, CMOs (profitability framing) | Growth, UA teams (efficiency framing) |
| Main risk | Misleading without accurate LTV | Overstates savings if incrementality is not isolated |
| Output | ROI as % profit return | ROI as % cost saved vs paid UA |
How ASO amplifies ROI across organic and paid growth
ASO improves visibility and conversion in the app stores, increasing the installs generated from all organic, paid, and referral traffic landing on your product page.
Improvements to your app store page increase conversion rate for organic traffic, paid campaigns, and external sources. AppTweak’s ASO Trends & Benchmarks report (2025) notes for example that apps using Custom Product Pages saw an average CVR boost of 5.9%, with generic campaigns reaching +8.6%. As a result, the same amount of traffic generates more installs, which leads to lower acquisition costs and improves profitability.
Second, ASO and paid UA reinforce each other. Paid campaigns generate valuable insights on keywords, audiences, and creatives that can be reused in your ASO strategy. At the same time, stronger organic rankings reduce dependency on paid acquisition by capturing more demand organically.
In practice, this means ASO does not just drive additional installs. It also makes your paid campaigns more efficient and increases the return on every acquisition channel.
How long does ASO take to show ROI?
ASO can show early signals quickly, but proving ROI with confidence takes more time.
In the short term, you can observe early signals within a few days to a few weeks after making changes. These include improvements in conversion rate, changes in keyword rankings, or shifts in impressions. These signals indicate that your optimizations are having an effect, but they are not enough to prove business impact yet.
To measure ROI reliably, it requires enough time to gather incremental insights, compare performance against a baseline and isolate the true impact of ASO changes.
In practice:
- Short term (weeks): directional signals and performance indicators
- Mid to long term (1 to 3 months or more): validated incremental impact and ROI
The key is to avoid drawing conclusions too early. ASO ROI becomes credible only when it is supported by consistent trends and proper measurement methods.
How do you prove ASO incrementality?
You prove ASO incrementality by estimating what would have happened without ASO engagements and comparing it to actual performance.
Methods include:
- A/B testing or holdouts
- Matched market tests
- Time-series analysis
Incrementality is the foundation of credible ASO ROI.
Expert Tip
Use AppTweak’s ASO incrementality measurement feature to measure the install lift from individual creative and metadata changes, aggregate them into a total annual ASO contribution, and model what would have happened without those changes. The All Ranked Keywords report helps estimate non-brand organic search share.
How should ASO ROI be reported to leadership?
ASO ROI reporting should stay simple, focused, and tied to business outcomes. Leadership does not need a full breakdown of rankings, keywords, or store experiments. What they need is a clear story of what changed and what it delivered.
A strong report focuses on two or three key metrics, such as incremental installs, revenue, or cost savings. It is also important to clearly distinguish what is directly measured from what is estimated, especially when working with incrementality models.
For example, instead of saying that conversion rate improved, explain what that improvement generated in terms of installs or savings.
A clear way to present this would be: ASO improvements increased conversion rate by 12 percent, which generated 25,000 incremental installs and reduced paid acquisition costs by $75,000.
This kind of reporting builds trust because it is concise, transparent, and directly tied to business impact.
Common mistakes when measuring ASO ROI
The most common mistakes when measuring ASO ROI include:
- Confusing ASO metrics with business impact: Keyword rankings, impressions, and conversion rate explain what is changing in store performance, but they are not ROI. ROI is what those changes generate in terms of installs, revenue, or acquisition cost savings.
- Drawing conclusions too early: ASO can show directional signals within days to a few weeks, but these are not enough to prove business impact. Reliable ROI measurement requires enough time to compare performance against a baseline and isolate the true impact of ASO changes.
- Ignoring seasonality: Organic install volumes shift for reasons unrelated to ASO. Without accounting for seasonal trends, a natural uplift can be misattributed to an optimization that had little to do with it.
- Attributing all organic growth to ASO: Not all organic installs are ASO-driven. Brand searches are classified as organic but are not directly controlled by ASO. Reporting total organic growth as ASO impact overstates the contribution.
- Mixing paid acquisition effects with organic performance: Paid campaigns can influence organic rankings and impression share. Without holdout markets or test/control designs, paid spillover can inflate apparent organic performance.
- Reporting gross growth instead of incremental impact: Total organic installs include installs that would have happened without any ASO work. Only incremental lift above the baseline is attributable to ASO.
- Failing to document ASO changes: Without an audit trail of what changed and when, it is impossible to link performance shifts to specific optimizations.
Avoiding these pitfalls is essential to building a credible and defensible ASO ROI framework.
Conclusion
Measuring the ROI of ASO is not about applying a single formula or tracking surface-level metrics. It requires a structured approach that focuses on incrementality and connects store performance to business outcomes.
By distinguishing between ASO impact and business impact, and by using models based on ASO-contributed installs and LTV, or CPI savings, teams can move beyond assumptions and build a credible view of ASO’s contribution. This is what turns ASO from a visibility lever into a measurable growth driver.
Ultimately, the goal is not just to measure ASO, but to make better decisions with it. When ROI is clearly defined, consistently measured, and effectively communicated, ASO becomes easier to prioritize, scale, and align with broader growth strategies.
FAQ
How long does ASO take to show ROI?
ASO shows early performance signals, such as conversion rate changes, keyword ranking shifts, within days to a few weeks of making changes.
AppTweak analysis has shown that reliable ROI measurement requires one to three months of data to account for seasonality, establish baselines, and isolate incremental lift from other growth factors. Drawing conclusions too early is one of the most common ASO ROI mistakes.
What data do I need to measure ASO ROI?
Measuring ASO ROI requires four data sources:
- App store console data (App Store Connect or Google Play) for install and impression volume
- Mobile measurement partner (MMP) data for attribution, events, and revenue
- Paid UA data for CPI benchmarks
- A unified dashboard to connect them.
Without combining store and MMP data, it is not possible to isolate organic installs from paid ones.
How do you measure ASO incrementality?
ASO incrementality refers to the true impact of your app store optimization efforts on app downloads or revenue. It isolates the additional growth generated by ASO changes compared to what would have happened without any intervention.
To measure ASO incrementality, you first define a baseline that reflects expected performance without changes, then compare it to actual results after implementation. This can be done through controlled experiments such as A/B testing, holdout groups, geo-based comparisons, or statistical models like time-series forecasting.
How do I prove ASO impact?
Focus on three metrics that connect ASO actions to business outcomes: incremental installs, LTV-based revenue, or paid UA cost savings.
Avoid total organic growth metrics, which include installs that would have happened anyway.
Clearly separate what is directly measured from what is estimated, and always link an action (e.g. a creative update) to its result (e.g. a 12% CVR lift and 25,000 incremental installs).
Does ASO reduce paid acquisition costs?
Yes. ASO reduces effective CPI in two ways.
- First, it increases organic install volume, reducing the number of installs that need to be acquired through paid channels.
- Second, it improves store page conversion rate, which can improve efficiency of paid campaigns (particularly Apple Ads) and can lower CPI for the same budget.
Example: if ASO generates 10,000 incremental organic installs that would otherwise cost €2 each through paid UA, the implied saving is €20,000—before accounting for any improvement in paid conversion efficiency.
Is ASO worth it compared to paid ads?
ASO and paid UA serve different functions. Paid acquisition delivers immediate, controllable scale. ASO generates compounding returns over time and improves the efficiency of every acquisition channel, including paid. The most effective mobile growth strategies combine both: ASO reduces the cost of paid acquisition while paid campaigns generate keyword and creative insights that feed back into ASO strategy.


More articles in App Store Marketing Blog

 Pierre-Antoine Roy

 Micah Motta