
App download and revenue estimates are a critical metric for marketers and developers aiming to grow their apps. They help you benchmark competitors, understand category dynamics, and validate whether a market is truly worth investing in.
In this article, our data science team shares how we, at AppTweak, estimate app downloads and revenues and why you can confidently rely on AppTweak’s intelligence to support your app’s growth strategy.
Key takeaways
- App download estimates are projected figures which indicate how many times an app has been installed.
- Download and revenue estimates are most useful for benchmarking performance with competitors and tracking trends over time.
- AppTweak’s Market Intelligence Starter plan gives free access to download and revenue estimates for apps and publishers across the App Store and Google Play.
- AppTweak models estimates using a proprietary deep-learning model trained on anonymized app store performance data, leveraging signals like category rank, country, and seasonality.
- Revenue estimates rely on Top Grossing signals, which reflect monetization performance rather than install volume.
How to get app download and revenue estimates for any app
Because Apple and Google don’t publish downloads or revenue publicly, the only way to access this data for competitor apps is through app market intelligence platforms like AppTweak.
These platforms provide download and revenue estimates by modeling performance using a mix of anonymized, aggregated app performance data from opted in apps and public app store signals such as category rankings, market dynamics, and seasonality.
The challenge is that app market intelligence platforms are often expensive, which makes competitive download and revenue data hard to access, especially if you’re simply trying to benchmark a few competitors.
Access free app revenue and download estimates in AppTweak
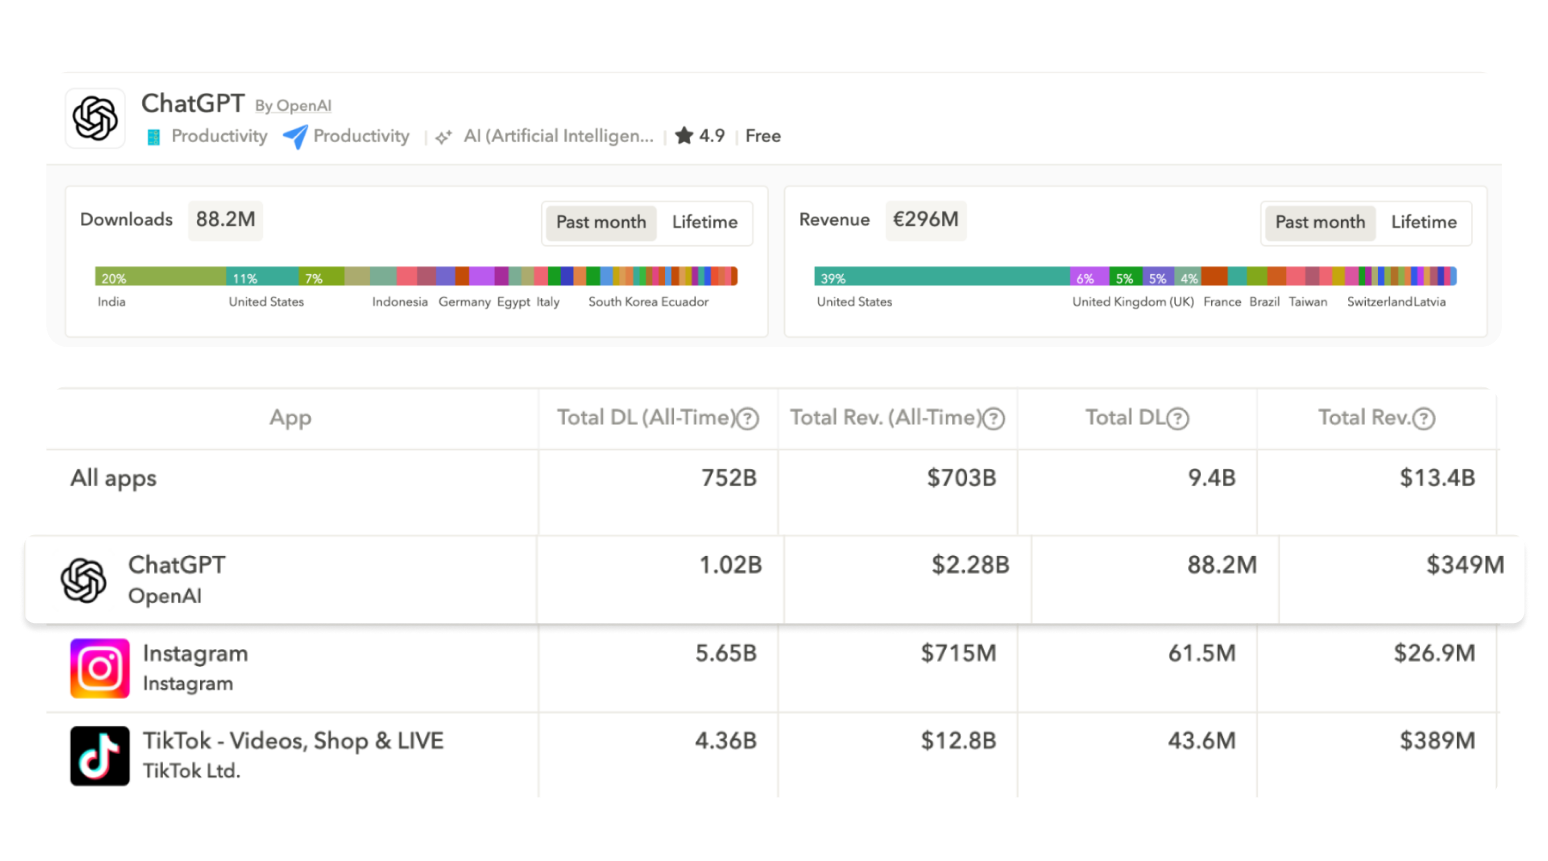
That’s why AppTweak offers free access to download and revenue estimates through its Market Intelligence Starter plan. With the Starter plan, you can access download and revenue estimates for apps and publishers for free, across both the App Store and Google Play.
AppTweak’s free Starter plan also lets you:
- Explore worldwide top charts to spot trending apps in your category and country
- Analyze publisher portfolios by viewing total downloads and revenue at publisher level, and breaking those estimates down per app in their portfolio
AppTweak’s paid app market intelligence plans unlock more advanced data and analysis, including deeper filtering, competitor segmentation, and more granular market and seasonality analysis.
Read more about our Starter plan and the next-gen updates to Market Intelligence.
How accurate are app download and revenue estimates?
The honest answer is that no third-party platform can provide perfect accuracy, because the App Store and Google Play don’t publish raw download or revenue numbers. That said, download and revenue estimates can still be highly reliable for decision-making when they’re based on consistent methodology, strong data coverage, and models that account for real market dynamics.
In practice, estimates are most reliable when you use them to benchmark and track trends, rather than treating them as exact figures. For example, they’re especially useful to compare competitors against each other, track growth over time, identify market shifts (like a category surge or decline), and benchmark performance across countries and categories.
Like any model, estimate accuracy also depends on the environment. Estimates tend to be more reliable when category ranking behavior is consistent and the app’s performance follows predictable patterns. Accuracy can be harder during sudden spikes caused by short-term paid campaigns, viral moments that create unusual download surges, or in markets and categories where public store signals are limited.
What factors are taken into account when estimating downloads?
App download estimates are primarily based on an app’s category rank (and its correlation to daily downloads), seasonality, and country-level market dynamics.
Category rank and its correlation with daily downloads
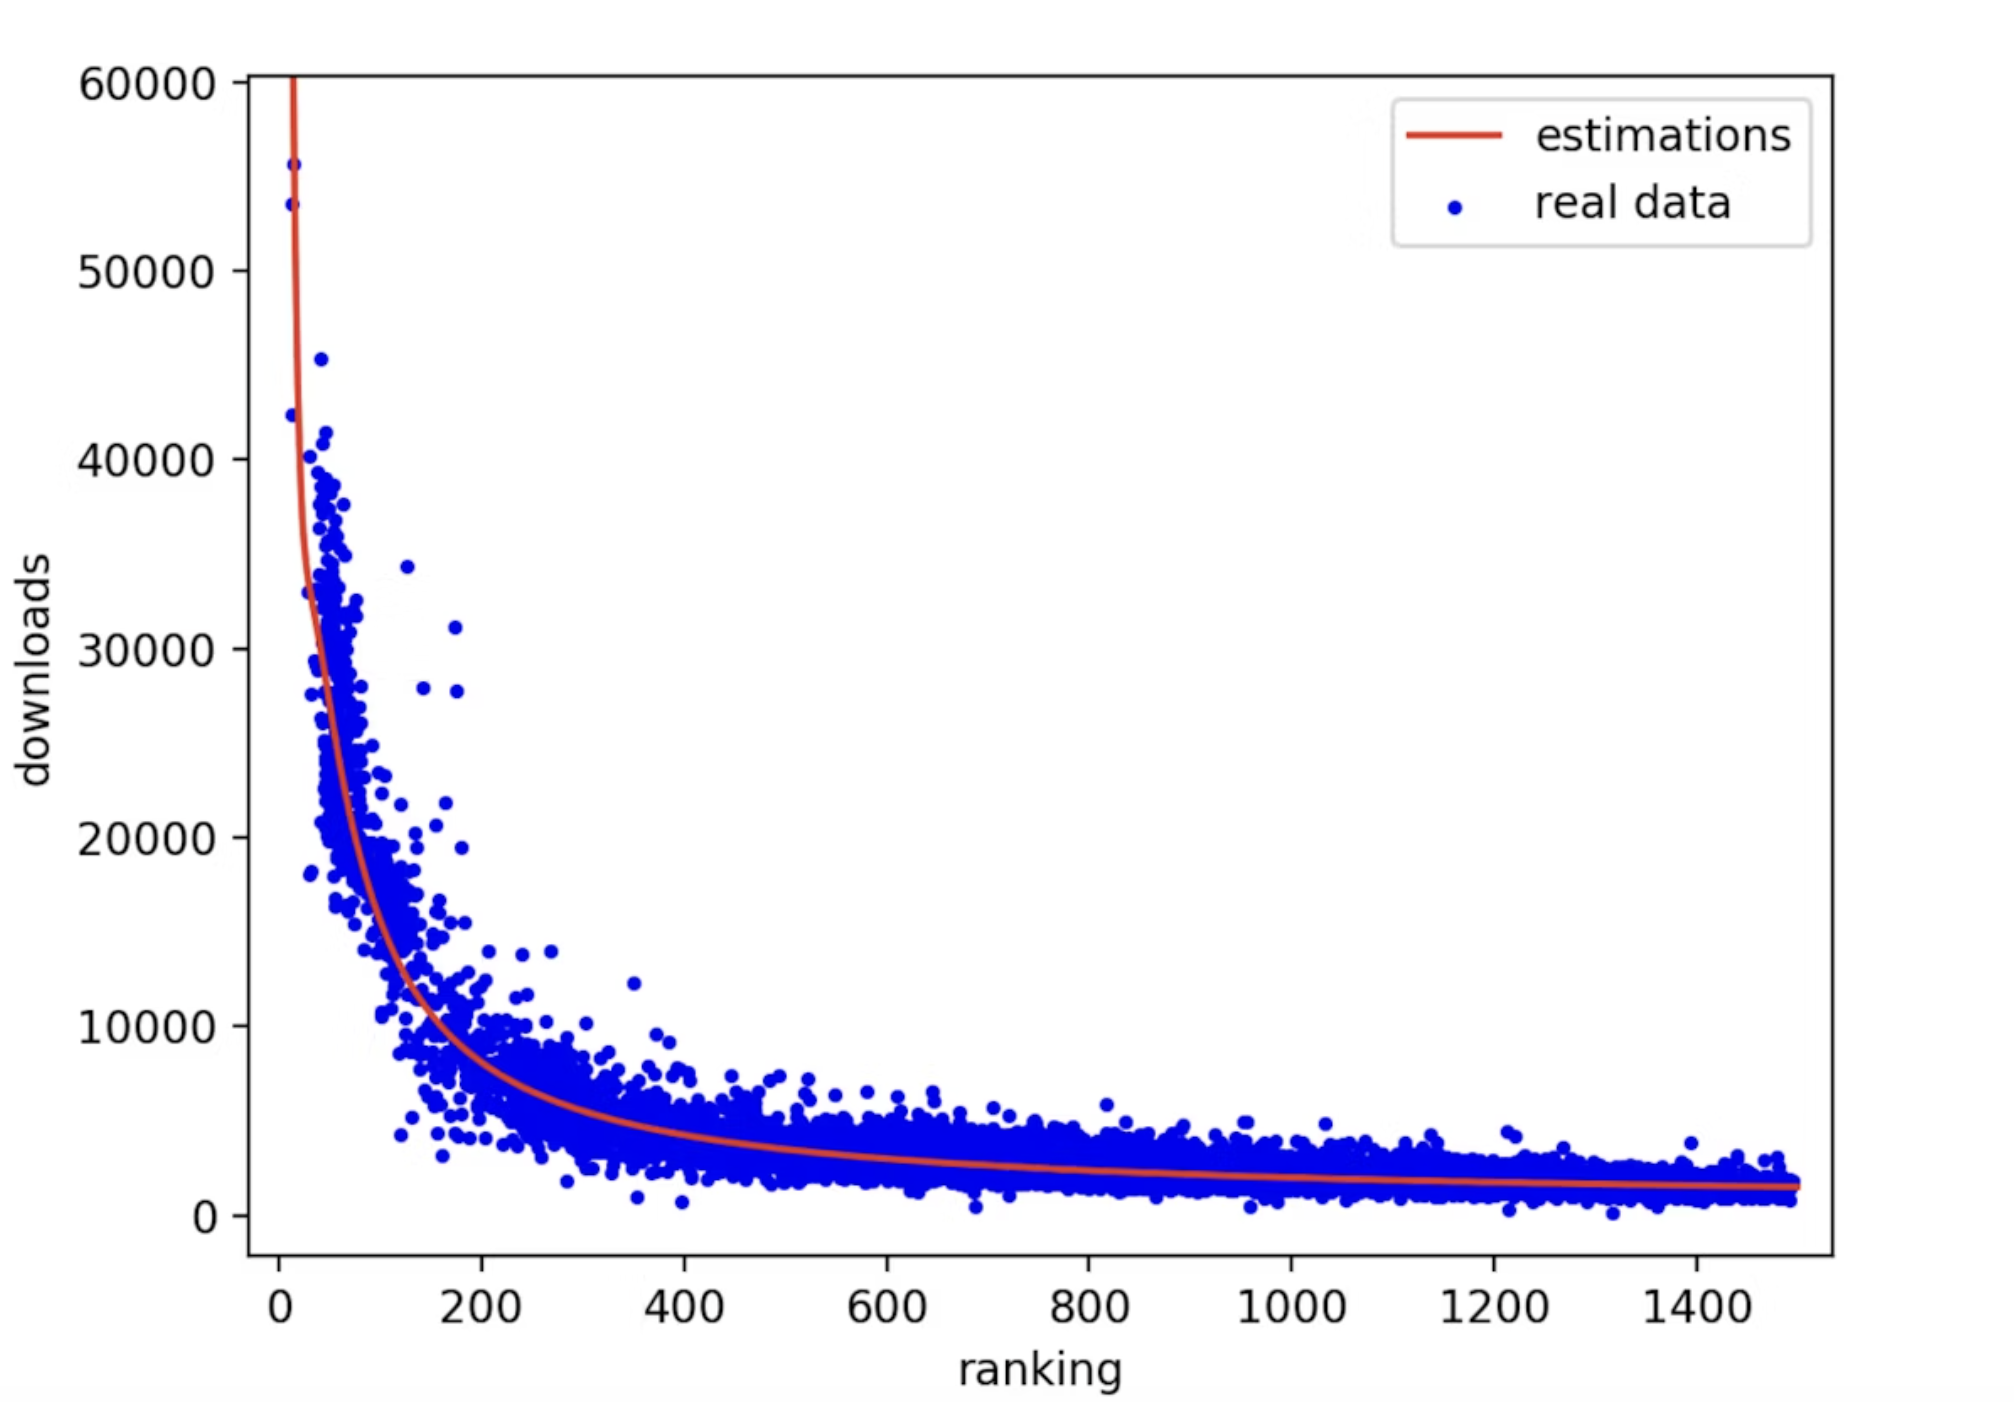
There is a strong and well-established correlation between an app’s category rank and the number of daily downloads it receives. As installs increase, apps typically climb in category charts; when installs decline, rankings tend to drop. This relationship allows estimation models to translate ranking behavior into projected download volume.
Category competitiveness
The same category rank can represent very different download volumes depending on the competitiveness of the category. For example, ranking #10 in Games requires significantly more daily downloads than ranking #10 in Tools or Productivity. High-volume categories such as Games, Social, and Entertainment demand exponentially more installs to reach top positions than smaller or niche categories.
Country-level market dynamics
Category rankings also behave differently across countries. Ranking #1 in a highly competitive market like the United States typically requires far more downloads than achieving the same rank in a smaller or less competitive market. Estimation models must therefore account for country-specific competitiveness and user behavior.
Seasonality
Seasonality significantly influences app download volume, even when rankings remain unchanged. An app ranked #1 during Black Friday, major sports events, or peak travel seasons will drive substantially more downloads than an app holding the same rank during quieter periods. Accurate estimation models account for these predictable seasonal patterns to avoid misinterpreting temporary spikes or dips as structural growth or decline.
Let’s look at a few seasonality examples.
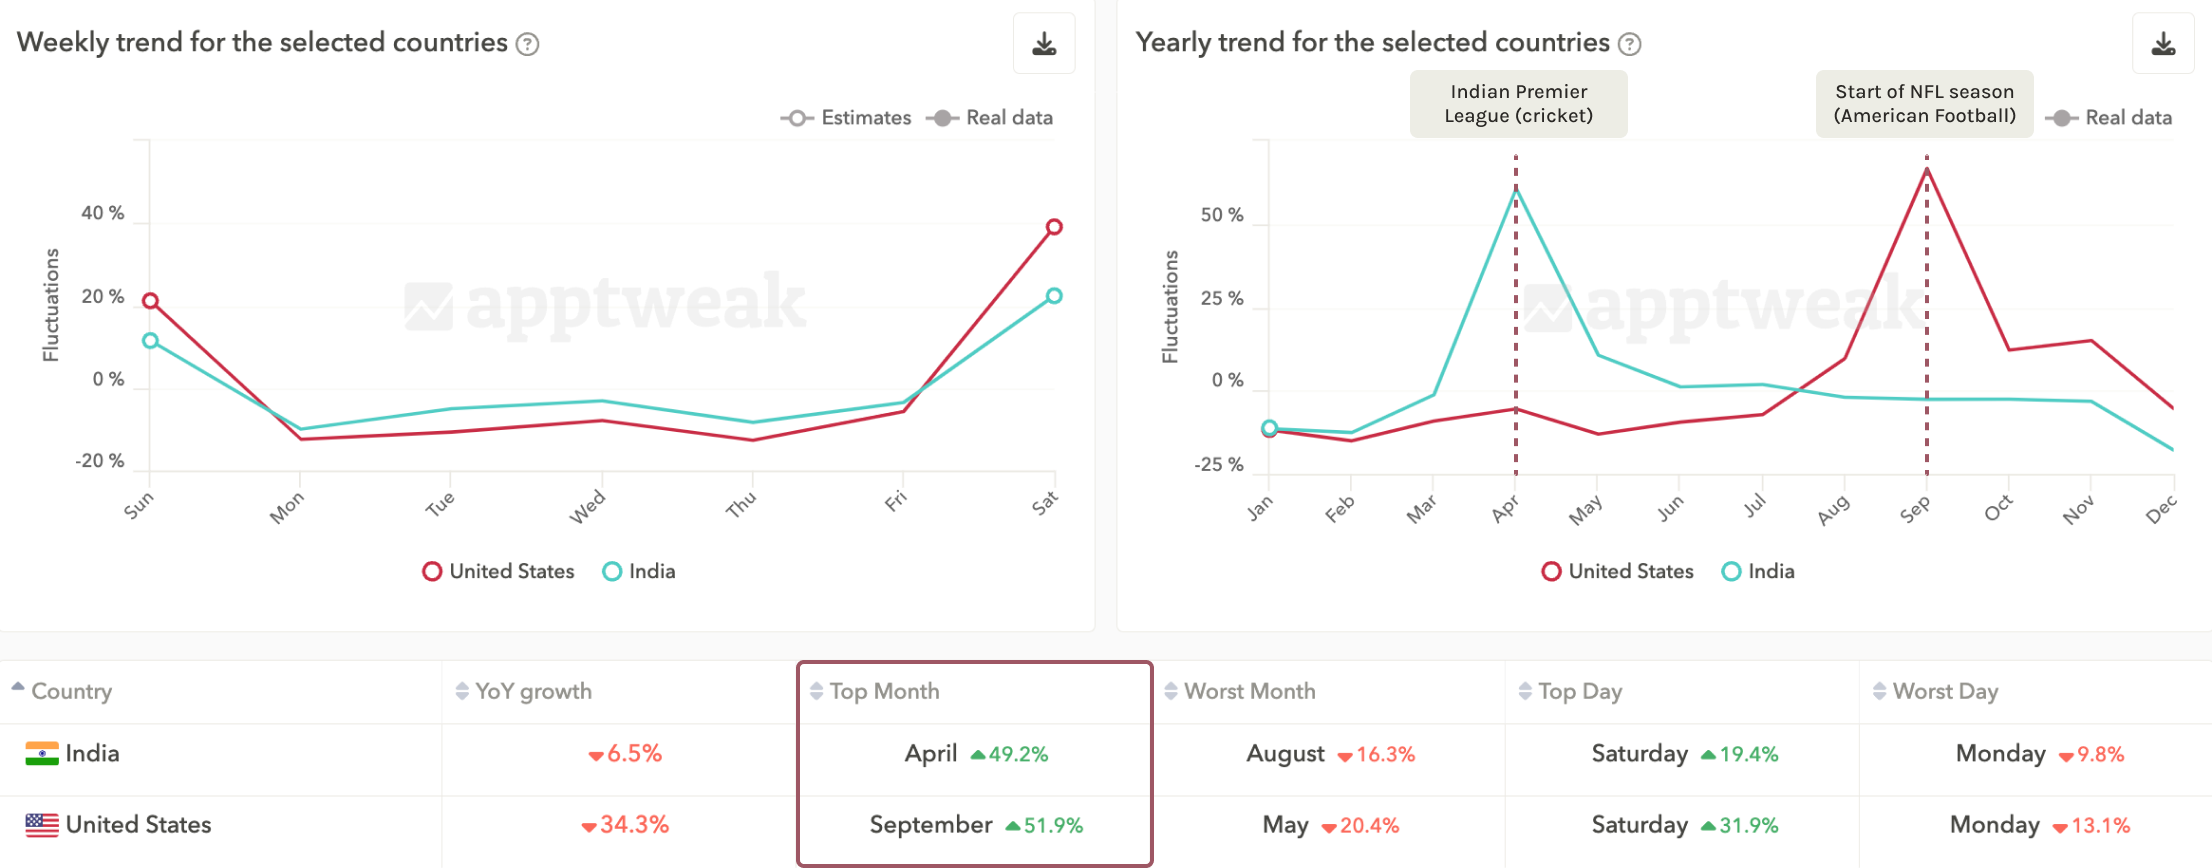
Sports apps and seasonality
Sports apps typically see an increase in downloads around popular sports events in different countries. For example, in the U.S. football season starts in the month of September, during which we observe an increase in downloads of up to 51%. In contrast, Indian sports apps see peaks of up to 50% in app downloads during the Indian Premier League in April.
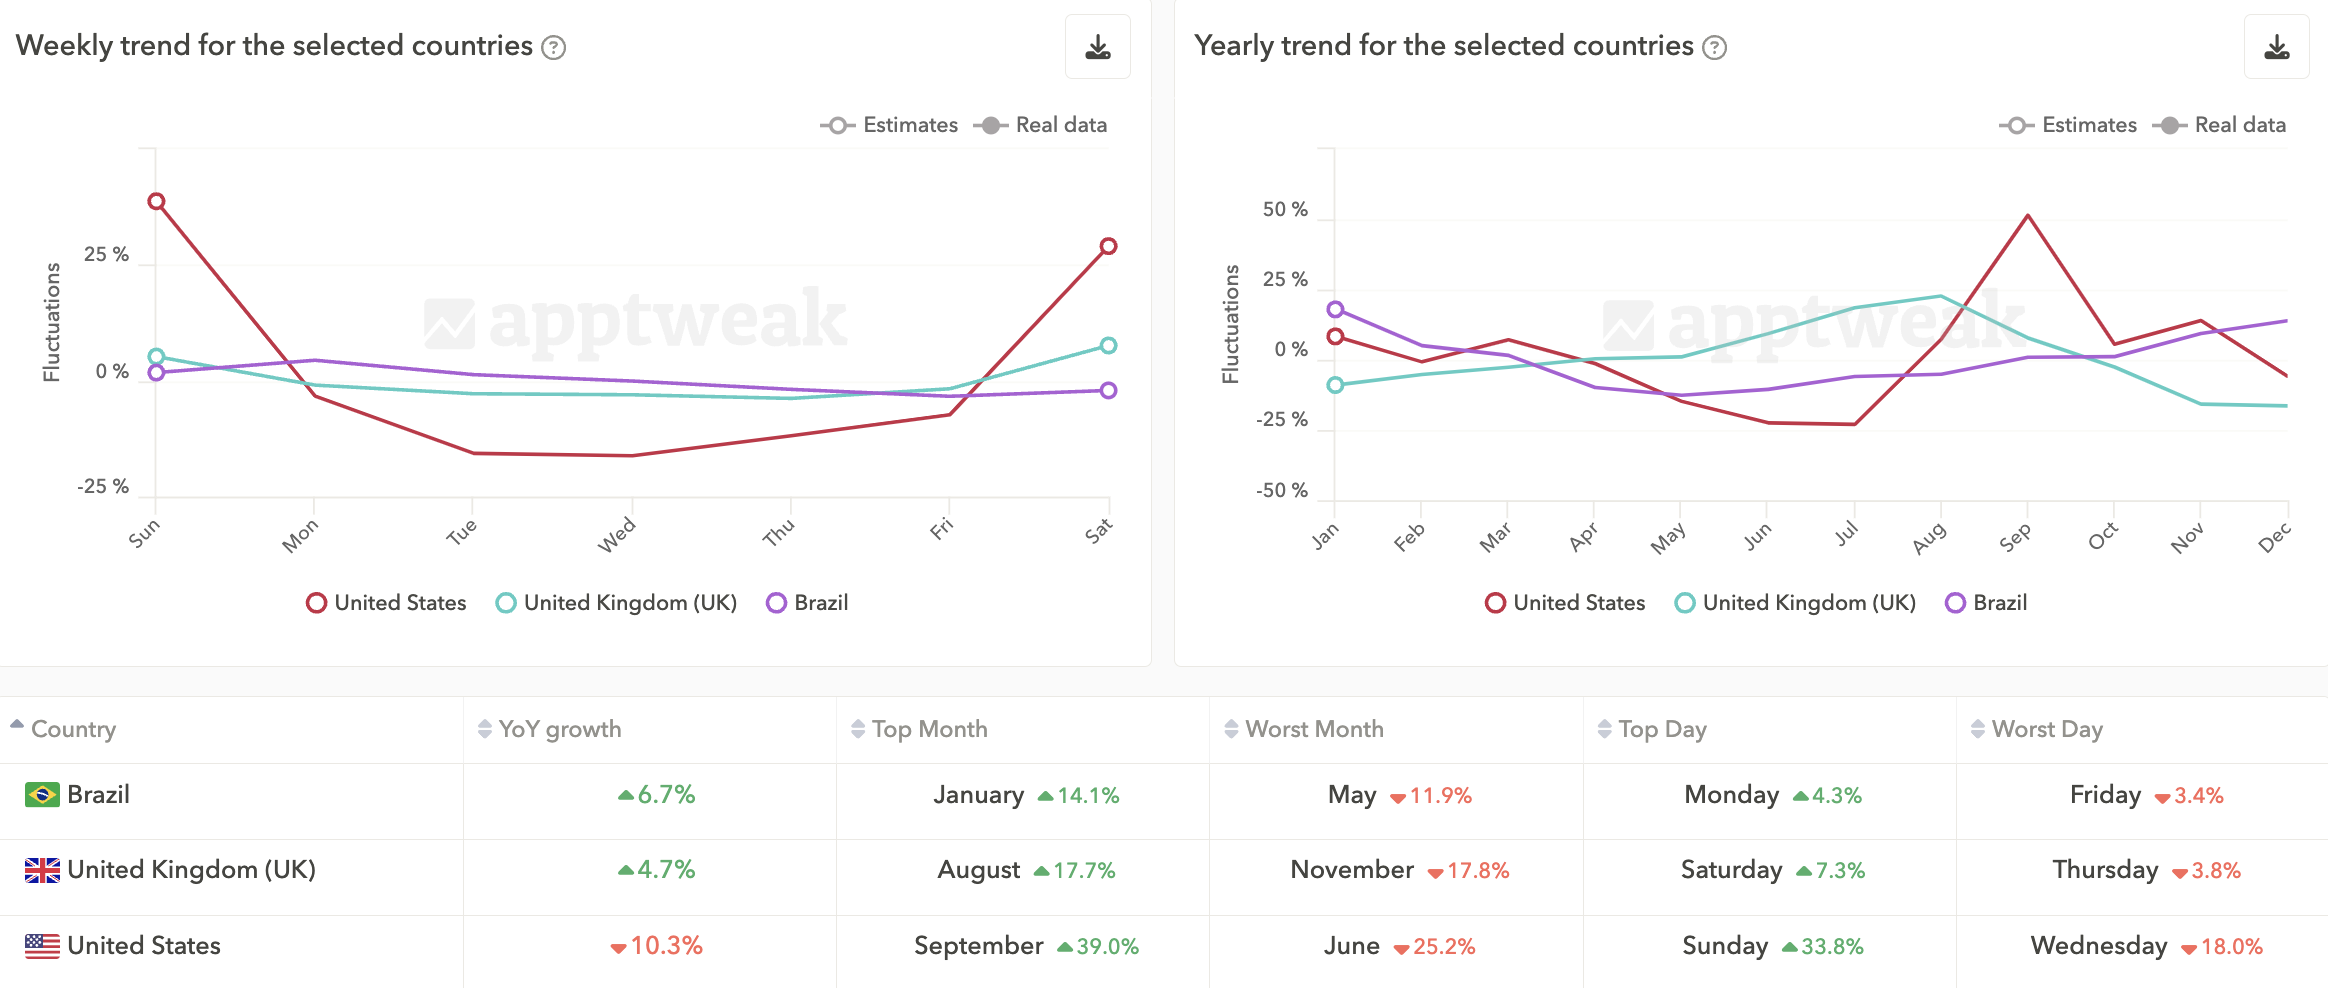
Travel apps and seasonality
As you can expect, app downloads for the travel category differ from one hemisphere to another. In the U.S. and the U.K., travel apps enjoy greater downloads during their summer months of June through September while those in Brazil see a similar increase during their summer between October and January.
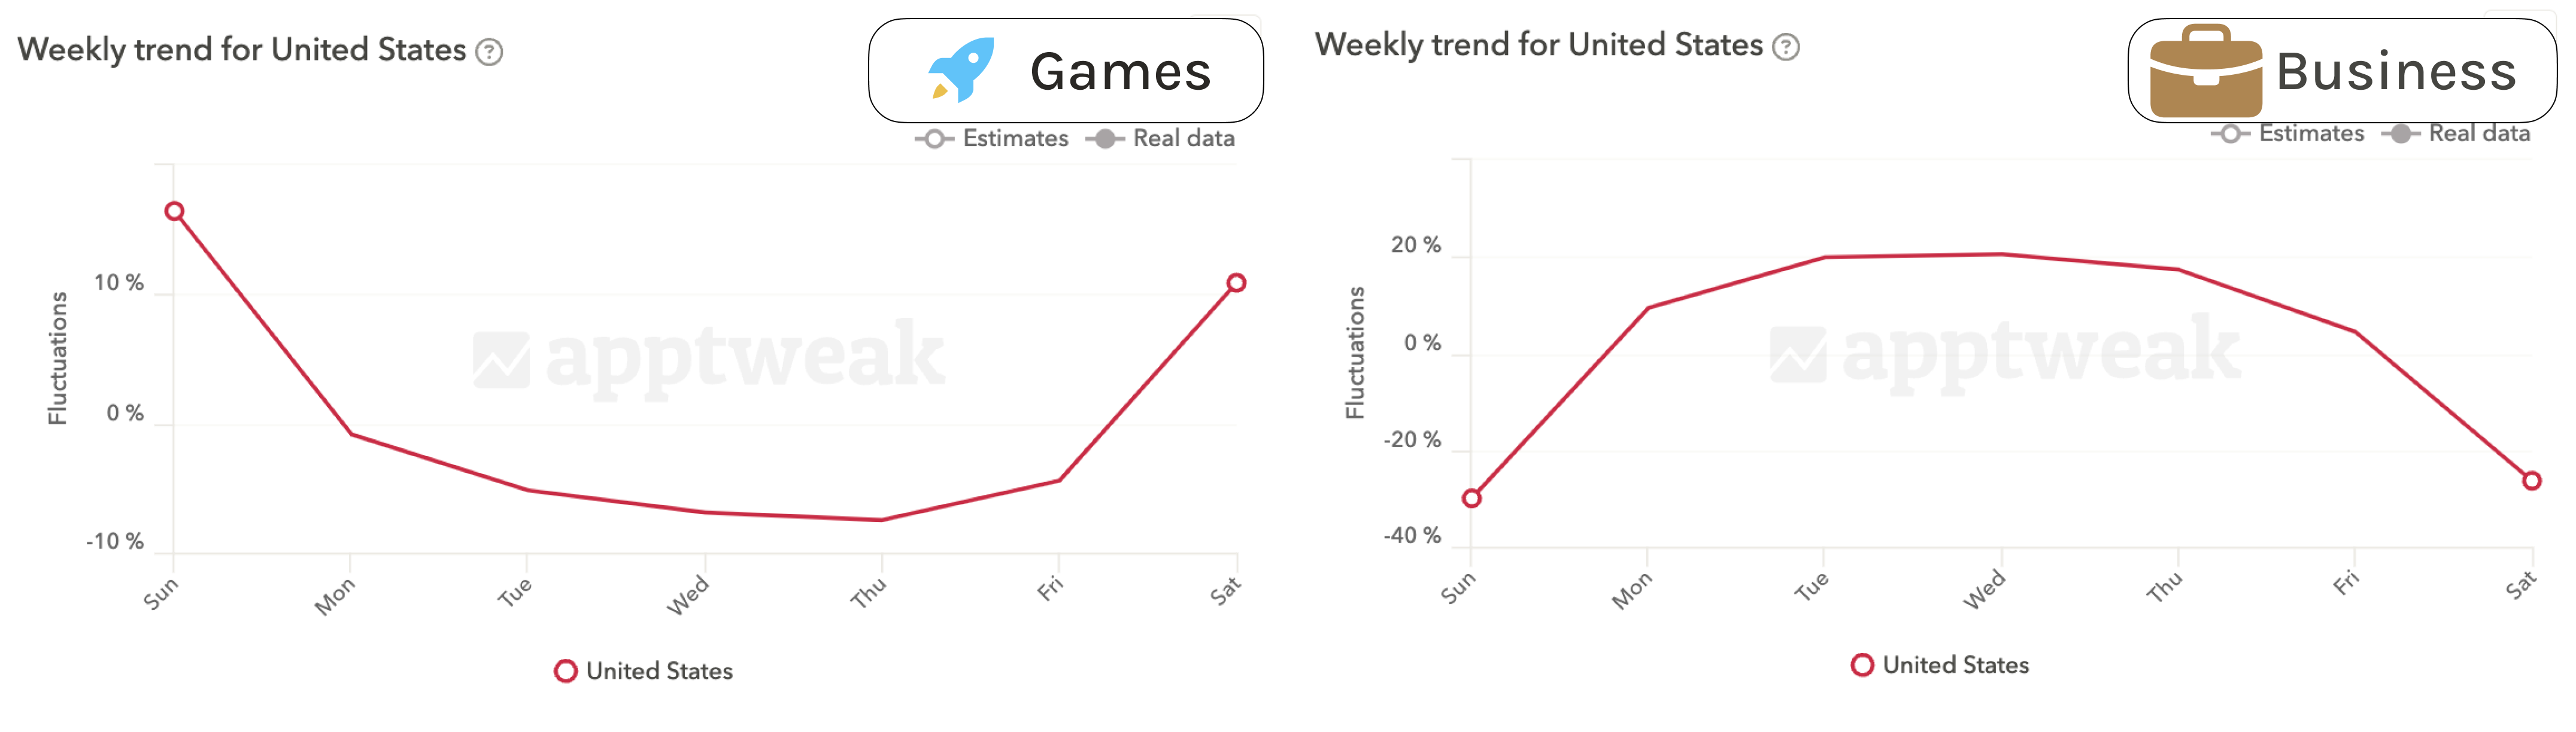
Games vs. business apps seasonality
Seasonality can be inspected not just on a monthly basis, but by looking at the app download data by week to see if there are trends like weekdays versus weekends. Unsurprisingly, mobile gaming apps tend to earn more downloads during the weekend than the weekday while business apps see more downloads during the week. Also this needs to be taken into account in the model.
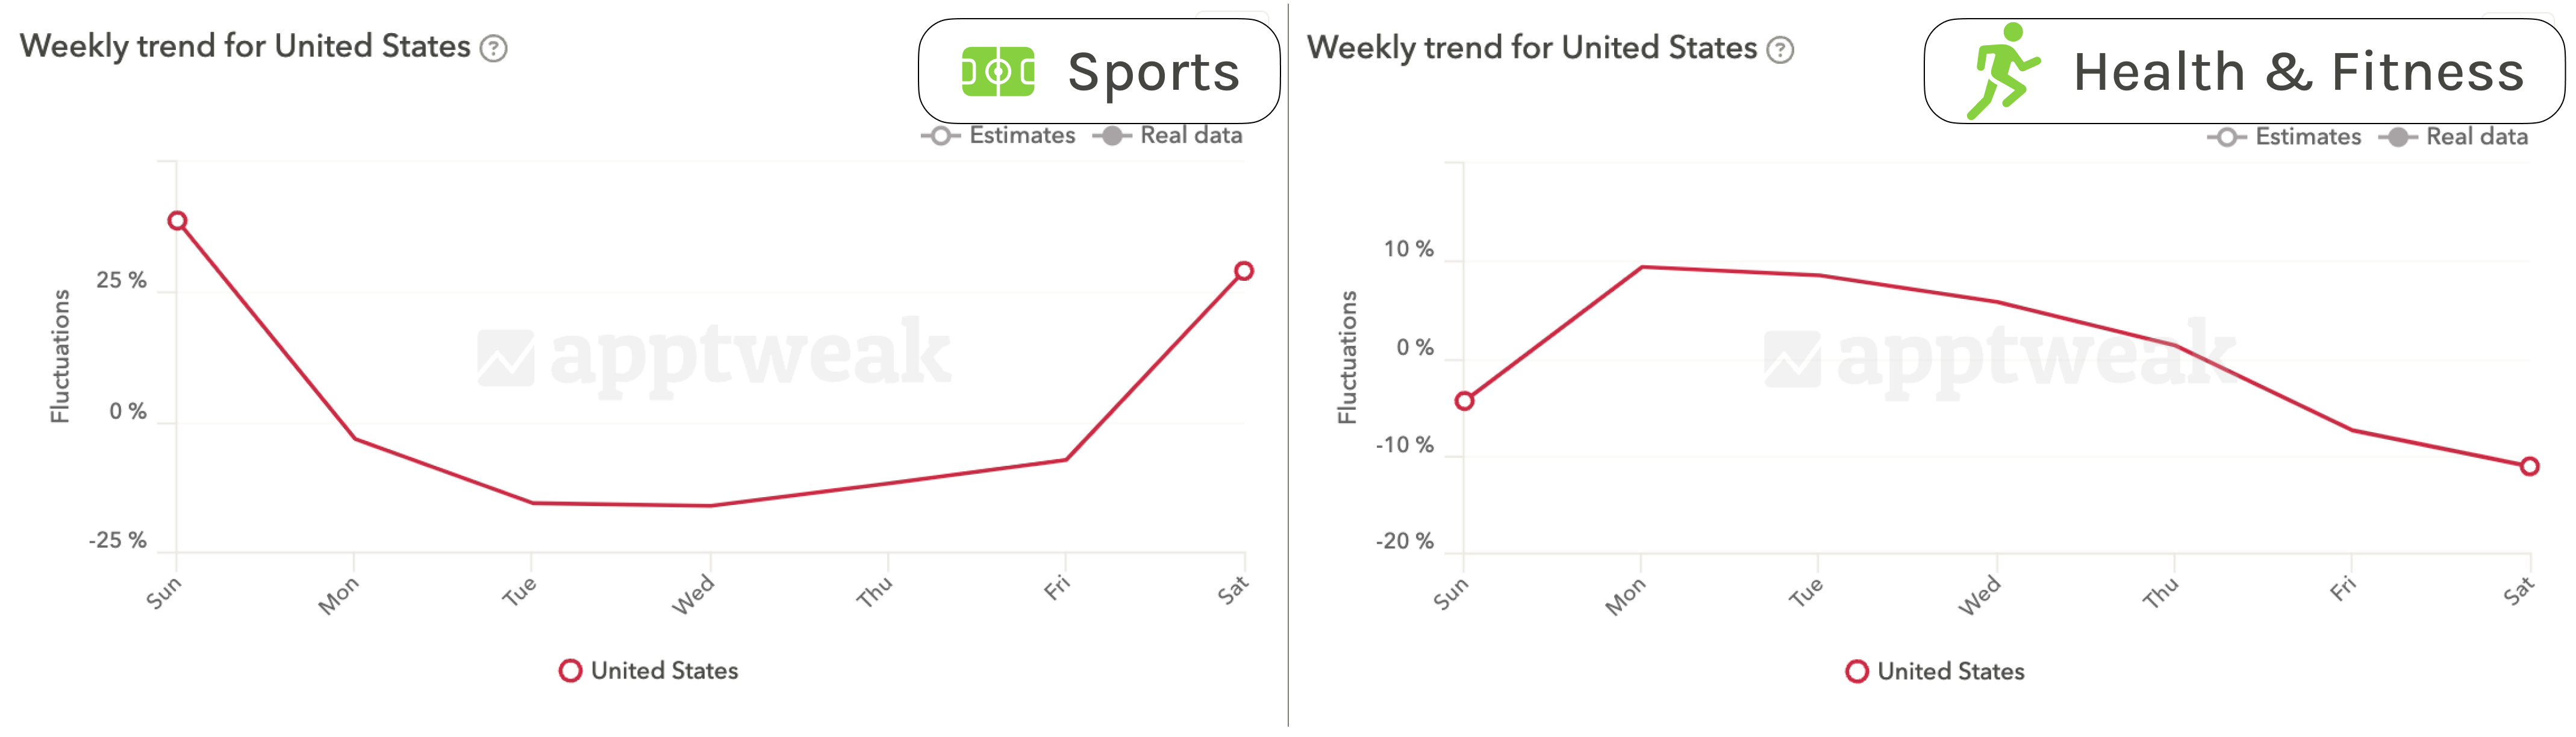
Sports vs. Health & Fitness apps seasonality
Other categories that see these weekly trends include sports and health & fitness apps, and quite opposite trends at that. Sports apps downloads shoot up on the weekend, when most sporting events occur. Health & fitness apps, on the other hand, are most often downloaded at the beginning of the week when people reset their fitness and wellness goals.
More on our market seasonality feature
All these factors—category, country, competitiveness, and seasonality—mean that estimates can’t be built on rank alone.
You need a model trained to account for seasonality effects across categories and countries, so predictable seasonal spikes don’t get misinterpreted as unexpected growth (or decline).
AppTweak’s approach to download estimates accounts for this by using a proprietary deep learning model designed to work across countries and categories, so estimates stay comparable and consistent when you analyze different apps, regions, or verticals.
Revenue estimates use monetization signals, not download signals
Revenue estimates are calculated using store signals that reflect monetization performance—primarily Top Grossing chart behavior—rather than download volume.
Downloads are strongly linked to category rankings, and revenue, however, is driven by monetization performance. An app can generate significant revenue with relatively few installs, while another app may drive massive download volume but monetize very little.
That’s why revenue estimates can’t be modeled using the same signals as download estimates.
In practice, revenue estimation is grounded in Top Grossing chart behavior, which reflects monetization performance rather than install volume. By analyzing how apps move in Top Grossing rankings over time, estimation models can infer revenue trends and benchmark how well different apps convert demand into revenue.
It’s important to clarify what “revenue estimates” represent in this context. These estimates are designed to reflect store revenue performance as indicated by Top Grossing rankings (including in-app purchases and in-app subscriptions). They are not meant to represent every possible revenue stream outside of the app stores.
How AppTweak calculates app downloads
AppTweak has developed a deep-learning model to estimate app downloads.To truly dive into the data science driving AppTweak’s download estimates, we asked our Head of Data Science, Jonathan Frische, to explain the methodology and algorithms used by our team:
AppTweak trains our deep-learning model using anonymized data collected from thousands of apps connected to the platform, along with over ten years of historical app store data.
Every day, the model processes a consistent set of signals for each app in our database, including:
- the app’s category
- the app’s category rank
- the country
- the date (seasonality)
By mapping these signals to daily download performance, the model learns the most relevant relationships between ranking behavior, market context, timing, and download volume. This technique helps AppTweak uncover patterns such as the impact of seasonal events across categories and countries, or which markets have similar levels of competitiveness in terms of downloads.
Once the model has learned these relationships, it can estimate the number of downloads for apps for which AppTweak doesn’t have direct data, across any category, in any country, and at any point in the past. Thanks to the many metrics tracked during the learning process, AppTweak is confident that this model can estimate app downloads with extremely high accuracy.
How AppTweak calculates app revenue estimates
AppTweak estimates app revenue using a machine-learning model trained on Top Grossing chart behavior, combined with category, country, and time-based signals. AppTweak’s model estimates revenue performance as represented by App Store and Google Play Top Grossing rankings. By analyzing how apps rank and move over time in Top Grossing categories across countries, the model can estimate relative revenue performance at scale.
Revenue signals used to estimate app revenue at AppTweak
Apple and Google publish Top Grossing category rankings, which are ordered based on revenue generated directly within the app stores, including in-app purchases and subscriptions. These rankings provide the core signal for AppTweak’s revenue estimation model.
AppTweak’s model uses Top Grossing ranking behavior—how apps rank and move over time—as the primary indicator of revenue performance. As Jonathan Frische, Head of Data Science at AppTweak, explains, the model follows the same ranking-to-performance logic used for download estimates, but applies it to grossing rankings that are tied to revenue rather than install volume.
To accurately interpret Top Grossing rankings across different markets and monetization models, the revenue model processes additional contextual signals every day for each app and country where sufficient data is available, including:
- Top Grossing category rank
- App category, since monetization dynamics vary significantly across verticals
- Country
- Time-based signals, such as day of the week, month of the year, and overall seasonality patterns
AppTweak’s proprietary model also considers ranking history, not just a single day’s position. For example, an app that has ranked highly in Top Grossing charts for several consecutive days is inferred to generate more revenue than an app that briefly appears at the same rank after a long period of lower performance.
Category and country context matter
Revenue behavior differs substantially depending on both category and market. Ranking #7 in the Business category does not imply the same revenue level as ranking #7 in a Games or Sports Betting category.
AppTweak’s model accounts for this by treating the category itself as a signal, allowing a single model to adapt its predictions based on the monetization characteristics of each category and country.
Daily, country-level revenue predictions
AppTweak generates revenue estimates daily per app and per country, when enough recent Top Grossing ranking data is available.
If an app does not have meaningful ranking signals over a recent period (for example, no relevant Top Grossing rankings in the last several days), the model does not generate a prediction. This prevents producing estimates when there is insufficient information to support them.
Like AppTweak’s download estimates, revenue estimation models benefit from continuous retraining as more apps connect to the platform and new data becomes available, ensuring estimates remain relevant as market conditions and monetization strategies evolve.
Why AppTweak’s app download and revenue estimates are among the most trusted in the industry
No third-party tool can provide perfect accuracy. But estimates can still be highly reliable for decision-making when they’re produced with consistent methodology and strong data coverage.
That’s why trust in download and revenue estimates comes down to two things: scale and methodology.
1. Scale: built on a decade of real app store performance data
AppTweak’s ability to provide accurate download and revenue estimates is the result of the large pool of app performance data we have captured over the years. AppTweak has been collecting app store data since 2014, which gives our models the long-term history needed to understand what “normal” looks like across markets and categories, and what truly signals growth.
This scale matters because estimation is not just about one country or one category. App performance varies widely depending on market competitiveness, category dynamics, and platform behavior.
2. Methodology: built on proprietary deep learning
AppTweak’s model is designed to be both cross-country and cross-category, meaning it learns relationships between countries and categories rather than treating each market in isolation. This is critical because ranking behavior and competitiveness differ significantly depending on the country and the category.
As a result, AppTweak can provide stable download and revenue estimates that marketers can confidently use for competitive benchmarking, market sizing, and trend analysis across different regions and verticals.
“Phiture’s unique value proposition is to offer innovative solutions to our clients. By choosing AppTweak as our preferred data provider, we look to strengthen our position as the leading mobile growth consultancy in the market,” claims Moritz Daan, Partner & Co-Founder at Phiture. “Through this enhanced business relationship, we aim to further empower our clients with the right data tool to ensure their long-term success.”
FAQ
What are app download estimates?
App download estimates are projected figures that reflect how many times an app has been installed from major app stores like the Apple App Store and Google Play. Since most platforms don’t disclose exact download counts, these estimates are generated using models from third-party tools that analyze publicly available signals such as app rankings, category performance, and historical trends.
Why are app download estimates important?
App download estimates play a vital role in mobile marketing, competitive analysis, and investment decisions. App marketers utilize app download estimates to understand their app’s performance and compare it against competitors. Here’s why app download estimates matter.
How can I check how many downloads an app has?
To see how many downloads an app has, you need to rely on an app market intelligence platform like AppTweak. With AppTweak’s free Starter plan you can get download and revenue estimates for any app on the App Store & Google Play.
How do I get free app download estimates?
AppTweak’s Starter plan for its Market Intelligence product provides free access to accurate app download and revenue estimates for apps and publishers. These estimates include lifetime and last-month totals.
How do tools like AppTweak estimate app downloads?
Platforms like AppTweak use machine learning models trained using anonymized data from thousands of apps connected to the platform. It combines this with public app store signals like category rankings and, market context including category competitiveness and seasonality. By analyzing these elements across markets and devices, the algorithm can generate accurate, country-specific estimates, even when actual app download numbers aren’t publicly available.
How many app downloads can I expect?
There’s no one-size-fits-all number when it comes to app downloads. The number of downloads you can expect depends on several factors including your app’s category, market, competition, seasonality, marketing efforts, and especially the quality of your app store optimization strategy.
How many downloads to reach top rankings in my app category?
There’s no fixed number, because the downloads required to reach top rankings depend heavily on your category and country. Some categories like Games or Social are far more competitive and require significantly higher daily download volume than categories like Tools or Productivity. The same ranking also requires very different download levels across markets, for example the US typically requires far more downloads than smaller countries. The best way to estimate what it takes is to analyze category benchmarks and top chart performance in your target country over time, using app market intelligence tools. AppTweak has a specific feature to estimates how many downloads an app needs to reach #10 or #1 in the category.
How can I find app download statistics by country?
App stores don’t publicly share country-level download numbers for most apps, so the most reliable way to access this data is through app market intelligence platforms. Tools like AppTweak provide country-level download estimates by modeling performance using app store signals such as rankings, market dynamics, and seasonality. In AppTweak, you can view estimated downloads by country for any app or publisher, making it easy to benchmark competitors, identify high-growth markets, and understand how performance differs across regions. For the most recent app download data, check our latest statistics of app downloads data by country in 2025.


More articles in App Marketing, Product Updates

 Georgia Shepherd

 Micah Motta

 Simon Thillay