
If you have been doing ASO for some time, you must be familiar with App Store Connect and Google Play Console. Both platforms offer the possibility to download some of the data they record about your app; however, they do it in very different ways.
On the one hand, Apple allows you to quickly download any graph to a CSV which can be really nice when you want to share information with your team about a specific event. However, you don’t have the possibility to extract all of your “App Analytics” data at once if you want to include this data in your internal BI tool.
Google, on the other hand, has a whole section on its platform dedicated to exports – but you can only download your acquisition reports by month which means you might have to compile a bunch of CSV to be able to see your apps’ progression over the past year.
In the end, both of these solutions require a lot of manipulation before being able to import the exports into any BI tool. You end up spending more time formatting the data than actually analyzing it!
Automated Exports: No-code solution to power your reporting
AppTweak now offers Automated Exports for you to extract your App Store Connect & Google Play Console data in one simple click. The data is formatted in the same way and is sent at regular intervals to your preferred destination (CSV, Slack, or your data warehouse).
Getting started is simple! Sign up for AppTweak’s Automated Exports product and connect your consoles. Then choose which data you want to export, your preferred destination, and the frequency at which you want to get your data delivered. That’s it!
Read on for more detailed instructions.
Data collection
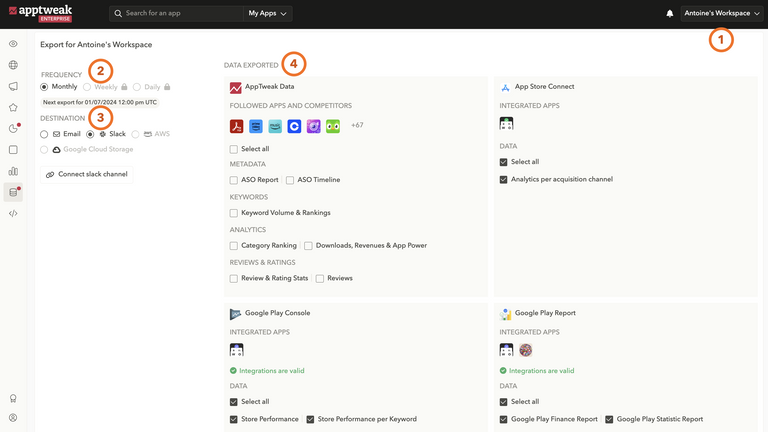
The first step is to select the workspace from which you will export the data. Make sure that the integrations you want to export have been shared with that workspace, otherwise this data won’t be sent.
The second step is to select the frequency which can be monthly, weekly, or daily.
Selecting your destination is the third step where you can choose from email, Slack, AWS3, or Google Cloud Storage (GCS). While email & Slack can be set up by yourself, you’ll need to get in touch with our team to set up cloud storage such as AWS3 or GCS.
Finally, in the fourth step, you have to choose the files you would like to export:
App Store Connect
- Analytics per acquisition channel (Search, Explore, App Referrer, Web Referrer) for the metrics: impressions, pageviews, 1st-time downloads, redownloads, sales, in-app purchases, active devices
Google Play Console
- Store Performance: Store Listing Visitors (SLV) & Store Listing Acquisitions (SLA) per acquisition channel for new, returning & all users
- Store Performance per Keyword: Store Listing Visitors (SLV) & Store Listing Acquisitions (SLA) per keyword
Google Play Report
- Google Play Statistic Report: New User Acquisition, New Devices, Updates & Uninstalls
- Google Play Finance: Revenue & Subscription Count
Data pipeline
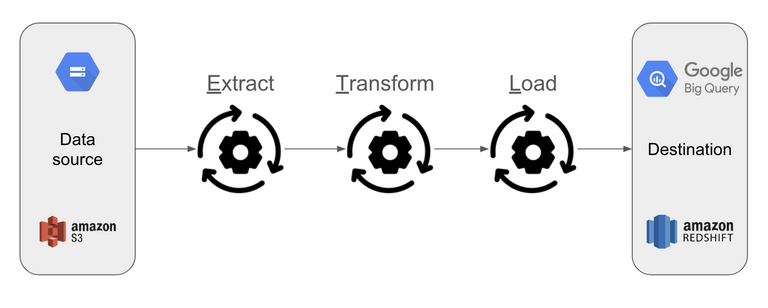
Once the data has arrived at your destination, you’ll need to set up a data pipeline to get your data into your internal BI tool – also called an ETL (Extract Transform Load). This step is required to collect data from different data sources and load them into a central repository called a data warehouse. Learn more about building a data warehouse to optimize your analytics infrastructure and streamline your ETL processes.
There are different options when it comes to the configuration of a data pipeline. You can either outsource this or do this in-house, depending on the resources you have available. The following options are available:
| Solution Provider | Tech Level Required | Description | Advantages | Inconveniences |
| AppTweak | None | AppTweak takes care of setting up the ETL for you |
|
|
| 3rd party tool: Clarisights, Adverity or Funnel | Basic | Using a third-party tool |
|
|
| In-house solution | Advanced | You build an ETL yourself |
|
|
Connect to your BI tool
The last step consists of connecting your target destination to your BI tool. There are various options but the most common one is Looker Data Studio because it’s easy to set up and can run on a free version.
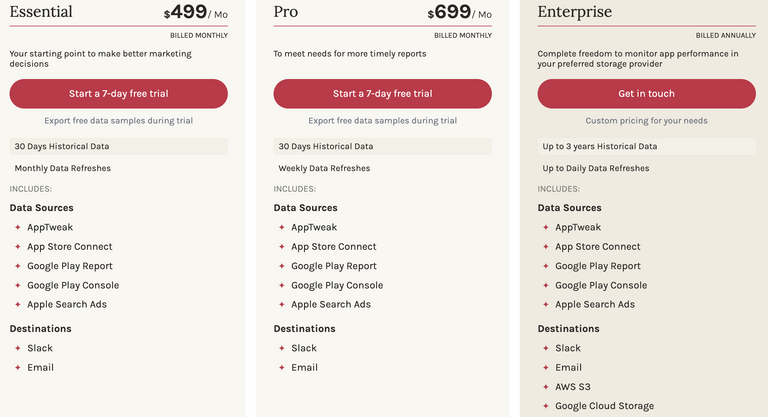
Pricing
You can start using Automated Exports for App Store and Google Play data with a 7-day free trial.


More articles in Product Updates

 Georgia Shepherd

