
In ASO, monitoring the performance of your app or game and comparing it to competitors is crucial. In AppTweak, you can easily measure the impact of your efforts by leveraging our App Analytics and AI estimates for any app in 100+ countries.
With Analytics, unite all your console & ASO data in one place (App Store & Google Play) to save time, get a holistic view of your performance, and monitor the impact of your work:
- ASO Intelligence: Category rankings, app power, download & revenue estimates, etc.
- Google Play performance: Daily user/device installs, daily user uninstalls, store listing visitors & acquisitions, sales, new/active/canceled subscriptions, etc.
- App Store performance: First-time downloads, redownloads, impressions, page views, sessions, active devices, sales, in-app purchases, paying users, etc.
- In-app events performance (iOS): Events impressions, page views, opens, reminders, notification taps, downloads, uninstalls, paying users, etc.
- Conversion rates (App Store & Google Play).
In this blog, we’ll discuss the various app analytics you can monitor in AppTweak and show examples of insights you can extract to track your growth.
Our App Analytics allow you to keep a close eye on your app’s category rank, app power, downloads, revenues, and more to judge how your app compares to competitors. You can monitor analytics for any app or game (e.g., one of your competitors) in specific countries or worldwide, or access real data and insights by connecting your console.
How to track worldwide app analytics on AppTweak
Below, we’ll deep dive into the specific metrics you can unlock in AppTweak’s Analytics section:
Quickly compare category ranking to competitors
Category ranking is one of the first metrics you’ll want to compare with your competitors. Both Apple and Google rank apps on a series of criteria, including app quality, total downloads, download velocity, etc. As a base rule, the more downloads an app has, the higher its category ranking will be.
If you want to keep an eye on category rankings over time, you can use the Ranking History graph. Here, you’ll be able to easily identify unusual movements that need extra attention.
For instance, above we compared the category rankings of AI apps in the Productivity category. We can instantly identify Chat with Ask AI as a clear category leader at the start of the date range; however, the app lost rankings and was overtaken by ChatGPT after its launch in the App Store on May 19, 2023.
Use the “ASO Impact” graph to measure successful marketing work
Estimate downloads needed to reach top rankings
Our category ranking section will also show you the estimated number of downloads your app needs to earn each day, to reach a certain category ranking. For instance, above we see that ChatOn – AI Chat Bot Assistant has also gradually lost rankings since the launch of ChatGPT. As shown in the examples below, the number of daily downloads the app now needs grows exponentially as its ranking goals get higher.

App Power: Easily compare performance across categories
The App Power is a unique metric developed by AppTweak. It is a number between 0 and 100 that indicates how powerful your app is and how its performance compares to apps in different categories or countries over time.
Learn more about the App Power

Let’s take the above example of dating apps, which often fall under the Lifestyle or Social Networks categories on the App Store (due to the absence of a dedicated Dating category). With the App Power, we can easily compare the performance of Bumble, Badoo, Hily, and Plenty of Fish, despite their different primary categories.
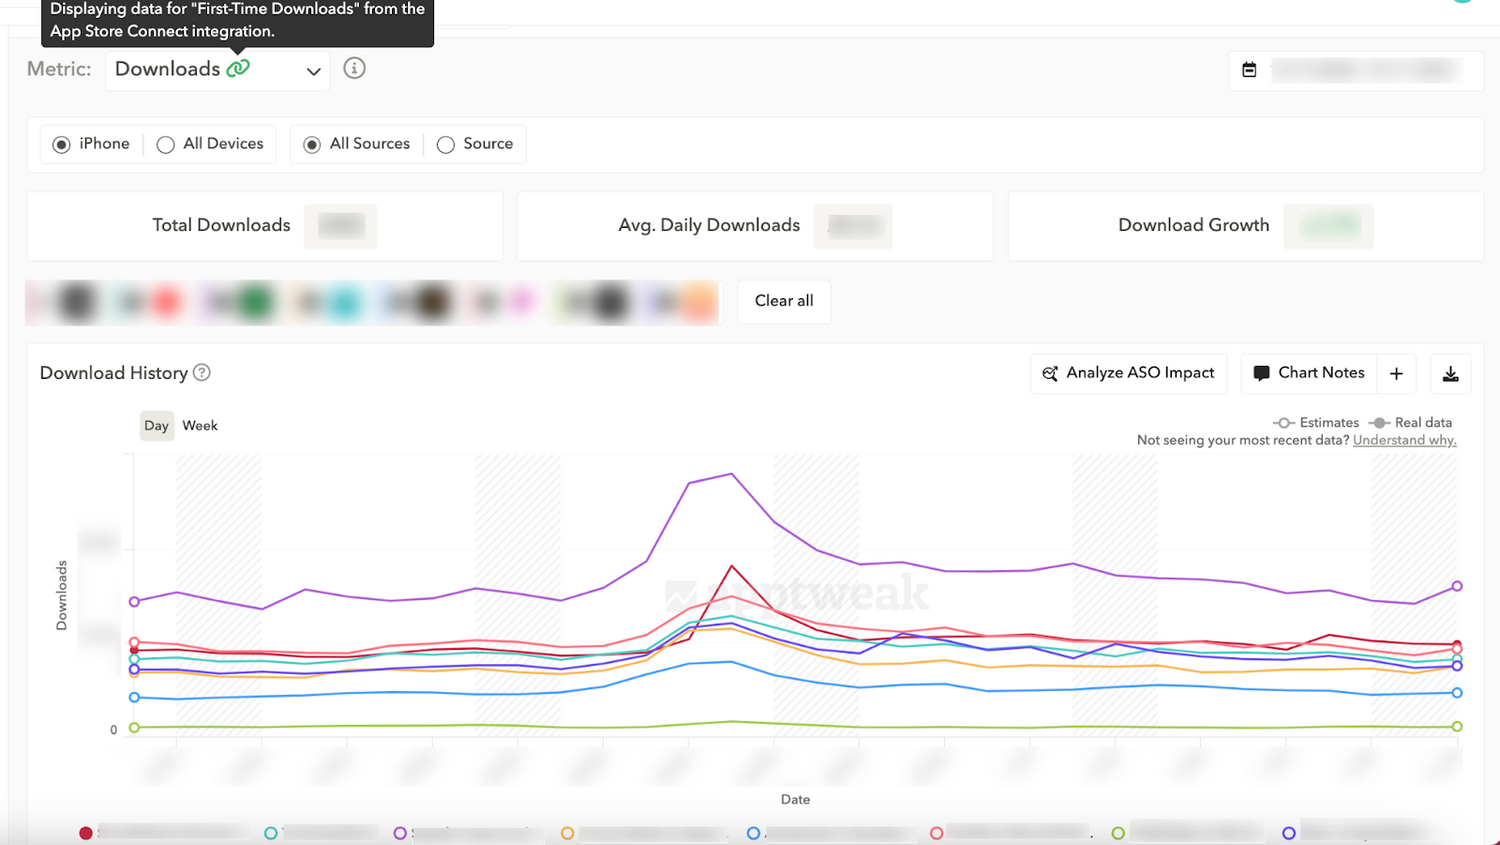
Compare real downloads to AI competitor estimates
Next, AppTweak’s AI-powered competitor estimates have led the market since 2014 in terms of accuracy, transparency, and ease of use. In Analytics, you can easily compare competitor download estimates with your real downloads: First-Time Downloads (iOS) or Daily Device Installs (Android) in one single view.
Learn more about AI tools & features in AppTweak
Monitor App Store downloads and impressions by source
Selecting the “Source” option will hide any competitor data and show a breakdown by source of the integrated app’s downloads. In AppTweak, you can break your traffic down into five different sources:
- App Store Search: Downloads after a user searches for a keyword in the App Store, including Apple Search Ads.
- App Store Browse: Discovery placements like Top Charts, “Today” tab, featured stories, similar apps, etc.
- App Referrer: Referrals from a link in another app.
- Web Referrer: Referrals from a link on a website.
- Unavailable: Undefined traffic source.
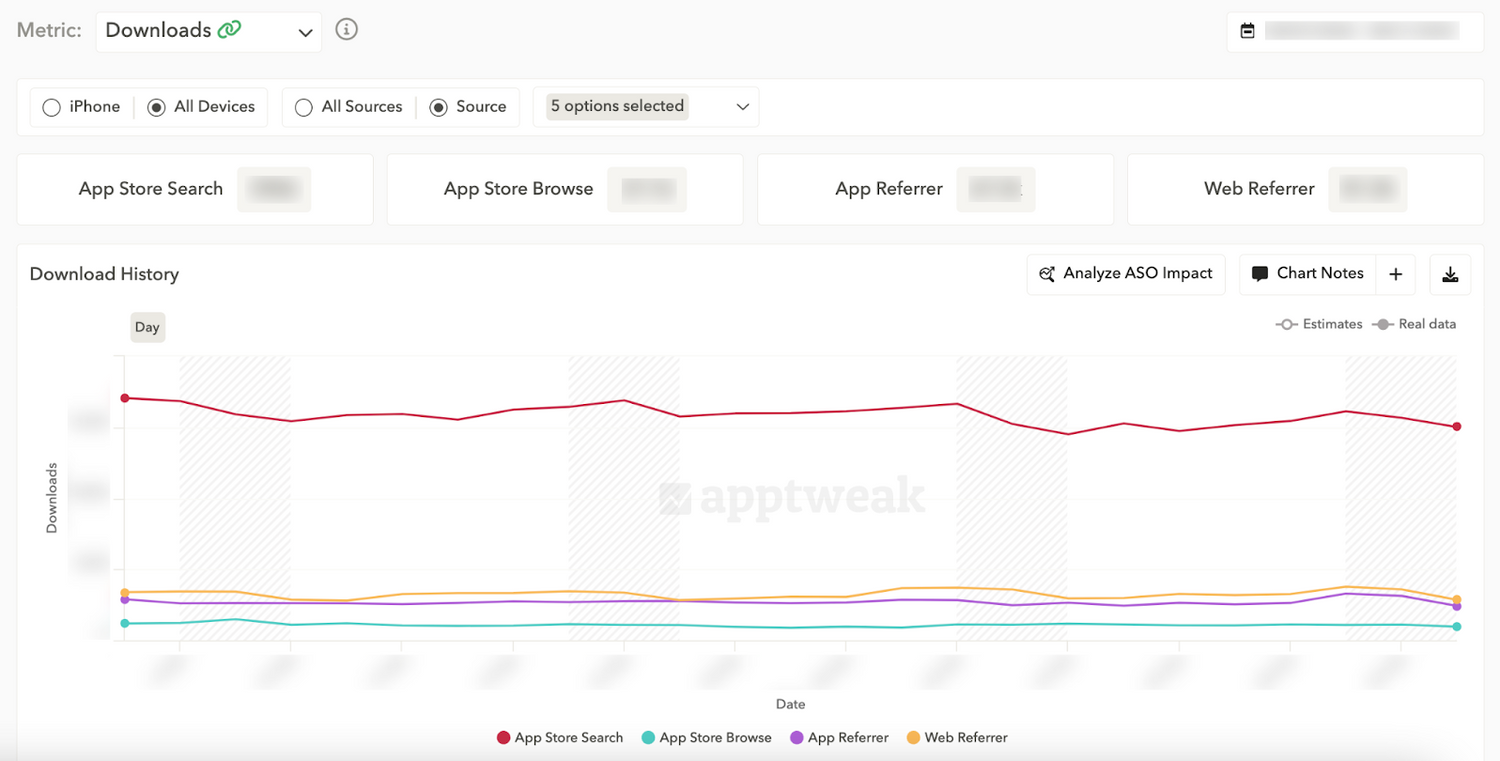
In practice, we often see (as shown above) that most downloads come from App Store Search, as a search represents a user’s high intent to download an app. However, when we compare this to Impressions (below), we see a completely different chart pattern:

Like many apps, we see that App Store Browse drives the most Impressions. Clearly, being featured is a huge opportunity to increase your app’s visibility.
Find tips to get featured on the App Store & Google Play
App and Web Referrer on the other hand, always drive 0 impressions. This is explained by the fact that App/Web Referrals use a URL that brings users directly to your app’s product page, skipping the Impressions step. This is also why Product Page Views will very often show App Referrer as the top traffic source.
Keep an eye on how active users are inside your app
When assessing the performance of each source, don’t forget to consider how many of your downloads translate into active users and sessions. A high number of downloads from a particular source might not be as valuable if they don’t lead to a significant increase in active devices and meaningful sessions.
Expert Tip
For instance, if Browse is driving a large number of downloads to your app but only a small percentage of these become active users, this may indicate that the Browse source is not effectively targeting your core audience. On the other hand, if App Referrer is consistently generating a higher proportion of active devices and sessions, this suggests that users referred by other apps are more likely to engage with your own.Understanding the relationship between your downloads, active devices, and sessions can help you finetune your marketing strategies, optimize user experiences, and focus on sources that deliver not only downloads but engaged and loyal users.

Monitor Google Play visitors & installs by source
For Android apps, users with an active Google Play Console integration will also be able to track the following metrics related to installs:
- Daily User Installs
- Daily Device Installs (use this metric to compare your real installs with competitor estimates)
- Daily User Uninstalls
Learn all about Atlas AI by AppTweak

To measure your Android installs by traffic source, you’ll need to open the Store Listing Visitors or Store Listing Acquisitions tab.
Store Listing Visitors on Google Play are similar to Product Page Views on the App Store; they measure the number of users that visit your app/game’s Store Listing. When breaking down your Android traffic by source, you’ll find three channels in AppTweak: Explore, Search, and Referral (similar to on iOS).

Above, we see an example of an app that observed a considerable decrease in its Store Listing Visitors from referrals. This decline could be explained by a reduction in the team’s advertising budgets (which we could highlight by using “Chart Notes”).
Conversion analysis: Measure CVR on Google Play & App Store
In Analytics, you can also quickly measure your Android app’s conversion rates (CVR) from Store Listing Visitors to Store Listing Acquisitions. As previously mentioned, keyword search is often the source driving the highest conversion rates on both the App Store and Google Play, as a search represents a user’s intent to download an app.

Conversion rates that we compute for the App Store are slightly different from Google Play. Given that we have three metrics on iOS – Impressions, Page Views, and App Units – there are three possible combinations:
- Impressions to Page Views: User has seen the app while searching or browsing the store and clicked it to view its product page.
- Page Views to Downloads: User has opened an app’s product page and then clicked the “Get” call-to-action to download the app.
- Impressions to Downloads: User has seen the app while searching or browsing the store and clicked the “Get” call-to-action to download the app, without viewing its product page.
Uncover average conversion rates per category for the App Store and Google Play
Analyze your app’s revenue & AI competitor estimates
When are users spending the most in the stores? We know that seasonality has a big impact on the number of users who view and download apps. But what about on revenue from in-app purchases and subscriptions?
Users who have connected their App Store Connect or Google Play Consoles in AppTweak are able to compare their own revenues with competitor estimates to understand more about revenue trends, seasonality, and more.

In general, the holidays can be huge opportunities for mobile apps and games to drive revenue. Looking at the example above, this app saw its real revenues and its competitors’ estimates increase on November 27, also known as Black Friday. When we look at in-app purchases or paying users, the pattern remains the same.
Learn more about app seasonality & its impact on ASO
On Google Play, apps offering subscriptions can also monitor revenue from active, new, and canceled subscriptions directly in AppTweak.
Discover which Google Keywords drive the most traffic
In addition to our App Keyword Monitoring tools, Analytics will also show insights about your app’s top-performing keywords. In particular, you can break down your Store Listing Visitors and Acquisitions by their keyword search and country (Google Play). In AppTweak, you can also go even further to break this information down by specific sources.

Our Google Keywords section allows you to easily check which keywords have driven the most Store Listing Visitors to your app and answer questions such as:
- Do these keywords also drive the most Store Listing Acquisitions?
- Which keywords perform better in search results vs. browse?
- Which keywords have the highest conversion rates?
These insights allow you to easily spot high- and low-performing keywords to see at a glance any peaks or drops that are worth investigating further to fully optimize your app’s growth.
In-app events: Track the performance of App Store events
Finally, you can also compare, monitor, and optimize the performance of your in-app events (event impressions, opens, taps, downloads, and more) in Analytics. This allows you to compare the effectiveness of your promoted in-app events to see which ones drive the best results, identify the reasons for their success, and spot areas of improvement.

Conclusion
In App Analytics, easily monitor and compare your apps’ real performance with various AI competitor estimates in one place. With over 30 metrics for the App Store and Google Play, track the following app analytics data (and more) directly in AppTweak:
- ASO Intelligence: Category rankings, app power, download & revenue estimates, etc.
- Google Play performance: Daily user/device installs, daily user uninstalls, store listing visitors & acquisitions, sales, new/active/canceled subscriptions, etc.
- App Store performance: First-time downloads, redownloads, impressions, page views, sessions, active devices, sales, in-app purchases, paying users, etc.
- Conversion rates (App Store & Google Play)
- In-app events performance (iOS): Events impressions, page views, opens, reminders, notification taps, downloads, uninstalls, paying users, etc.
To move beyond simply monitoring metrics, initiating a strong Exploratory Data Analysis routine helps uncover meaningful patterns, anomalies, and correlations, ensuring you understand why your app is performing a certain way before optimizing strategy.
Monitor all your app data in one place with an AppTweak ASO subscription.


More articles in Product Updates

 Georgia Shepherd

