
The most successful apps are able to adapt their international growth strategies to the needs and expectations of specific markets. However, it can be difficult to keep track of the countries you should analyze or prioritize at any one time. To support your market expansion efforts, we have developed the worldwide overview and cross-country analysis views on AppTweak.
To gain a quick overview of your app’s global performance, just select “worldwide overview” from the country selector (towards the top of the screen, in the app header) for a map view of where in the world your app is currently over- or under-performing.
Want regular access to worldwide insights for the countries that matter most to you? Select “Cross-country analysis views” to monitor the evolution of how your app is doing in its top-priority countries.
Key takeaways
-
App market analysis by country helps identify where your app performs best and where growth opportunities exist based on downloads, revenue, visibility, and conversion trends
-
Performance metrics such as app downloads, app revenue estimates, rankings, and keyword visibility can vary significantly by country due to differences in competition, demand, seasonality, and localization quality
-
Analyzing multiple countries side by side allows app marketers to prioritize markets for expansion, reallocate user acquisition budget, and adapt ASO strategy to local search behavior
-
Cross-country comparison highlights competitive intensity, showing how many installs or how much revenue is needed to reach top chart positions in each market
-
Using a unified platform to view app store data across 100+ countries reduces manual reporting and enables faster, data-backed decisions for global app growth
Compare your app’s category ranking around the world
Your app’s category ranking can vary widely from one country to another. This can be due to fiercer competition, high-performing local players, or certain markets needing stronger localization efforts for foreign apps to appeal to users.
Luckily, you can now use our worldwide overview to quickly identify countries where your app is ranking above and below its category average! The example below shows Amazon Music’s category ranking in the App Store Music category across the globe. We can easily see that the app is very popular in English-speaking countries such as Canada, the US, India, and Australia, and also has a strong position in Western Europe, Mexico, and Brazil.
 Amazon Music’s worldwide overview category rank in the App Store Music category
The worldwide overview also allows you to immediately pinpoint countries in which the app is underperforming. For instance, Amazon Music currently ranks lower in the Music category in other Latin American countries and in some Eastern and Northern European countries.
Seeing this, Amazon Music might then wonder which music apps are performing better in these specific countries. A quick look at the corresponding Top Charts already gives some insights:
 Top charts of the App Store Music Category across specific countries
Our Top Charts comparison instantly shows that Spotify is the #1 app in all these markets. SoundCloud and YouTube Music also seem to have good visibility, with other popular music apps including Shazam and GuitarTuna. In Latin America, users seem to prefer streaming music with eSound or local national radio apps. A closer look into these apps’ services and benefits – as well as their metadata and marketing campaigns – can provide valuable insights to enhance your international market entry and penetration strategies.
Discover how our Market Intelligence add-on facilitates in-depth app market research
Quickly identify where your competitors drive downloads
The worldwide overview can also help you identify the countries in which your competitors are driving most of their downloads or revenue, allowing you to better understand each country’s potential. Taking some of the music apps mentioned above and comparing their worldwide download estimates highlights some very clear trends:
 Comparing the worldwide download estimates of several popular music apps on the iOS App Store. From top to bottom (and left to right): Amazon Music, Spotify, YouTube Music, SoundCloud, Deezer, Musica XM.
Although these popular music apps all rank very well in most countries, the majority of their downloads are concentrated in the US. This demonstrates just how massive the US app market is, and how crucial it often is for international app growth.
Let’s look closer into the worldwide download estimates for each app:
- Most of Amazon Music’s downloads are concentrated in the US, but Japan also stands out as one of its top markets. That’s not the case for the other top music apps, suggesting Amazon Music’s successful penetration in the Japanese market.
- Although the US is Spotify’s main market for downloads, the difference between downloads driven in the US and in other countries isn’t as marked as for other apps (like Soundcloud or YouTube Music). It seems that Spotify’s app downloads are better spread across the world.
- It’s important to note that the colors of the graph are adapted to scale for the specific app’s downloads. Looking at the range of downloads for each app, we see that Spotify largely outweighs all other music apps in terms of downloads.
- Deezer and Musica XM have thrived in markets other than the US, such as France, Brazil, and Mexico. Again, it’s necessary to put things into perspective since the total downloads of these apps are much lower than those of the top US apps.
Comparing the worldwide analytics of apps in your category can help you understand which markets represent a higher potential for downloads. To gain the best insights and make your analysis more comparable, we recommend looking closely into your direct competitors rather than the top apps of your category. It’s also worth comparing performances on both the App Store and Google Play, since results can vary greatly from one store to another.
You can also repeat the above exercise to view worldwide trends in app revenue estimates and spot the most profitable markets for your competitors.
Monitor category ranking across your top-priority markets
Our Enterprise clients can also go even deeper in their analyses by tracking data only for the countries that matter most to their app growth.
Let’s say your app is available in the US, the UK, France, Canada, Japan, and India. Your category ranking has been stable at #1 on the French App Store, but you now want to regularly monitor movements in your category ranking across the remaining markets.
This is now easier than ever with the “Cross-country analysis” view (also available for app ratings – explained later in this blog). At the click of a button, you can now track your app’s analytics (category ranking, download estimates, app power, etc) for your target countries. Just follow the app in the markets you’re most interested in and choose “Cross-country analysis” from the dropdown to see the value of this feature.
 Select “Cross-country analysis” from the dropdown
Let’s return to the example of Amazon Music on the App Store, and focus on the US, Japan, Canada, India, Italy, Spain, and Mexico. The worldwide overview allowed us to identify Japan as one of Amazon Music’s top countries in terms of category ranking. We can dive deeper into our analysis using the cross-country analysis view and check how this ranking has evolved over time.
 Cross-country analysis: Category Rank (Analytics)
For instance, the image above shows us that Amazon Music’s rank in the Music category frequently oscillates between #1 and #2 in Japan. By cross-checking this information with our Top Chart History, we see that Amazon Music is in fierce competition with Spotify in this market. Investigating Spotify’s success in the market (by mining reviews, monitoring any in-app events, or spying on its paid campaigns) could definitely help Amazon Music gain an edge in terms of visibility and downloads.
 View Top Chart History: Top Charts of the App Store Music Category in Japan
Regularly monitoring this cross-country analysis also highlights that Amazon Music recently lost ranking positions in the US, dropping from 2nd to 6th position and potentially impacting its visibility. To understand the cause of such a drop, the team should quickly investigate further – did the app receive many bad reviews in this market? Did daily downloads suddenly decrease? What marketing campaigns were occurring in the US at this time?
Visualize downloads & revenue in the countries that matter
The cross-country analysis view also allows you to visualize an app’s total and average daily downloads across select countries, making it even easier to understand at a glance where your app is over- or under-performing. These insights are also available for your competitors, so you can compare how their downloads are spread across the same markets.
For example, below we can directly identify the US and Japan as the countries driving the most downloads for Amazon Music on the App Store.
 Comparing Amazon Music’s downloads across countries (App Store)
Comparing this breakdown by country from one store to another also allows us to distinguish Brazil and India as top-priority countries for Amazon Music on Google Play.
 Comparing Amazon Music’s downloads across countries (Google Play)
You can then go deeper into your analysis by comparing the revenue each country generates for the selected app. We’ll provide a clear breakdown of revenue estimates per country so you can easily spot the most profitable markets for your app.
For example, despite Brazil and India driving the most downloads to Amazon Music on Google Play, we should keep in mind that these countries are not particularly lucrative for the app. Instead, Amazon Music could consider prioritizing efforts in the US or Japan.
 Comparing Amazon Music’s revenue estimates on Google Play
Integrate your console for worldwide app analytics insights
Having your App Store Connect and/or Google Play Console data at your fingertips will be extremely handy to track your real app performance across the countries your team focuses efforts in.
Integrating your console with AppTweak will allow you to visualize even more data for the countries you follow! Just integrate your Google Play Reports or your App Store Connect console to see your app’s real downloads and revenues instead of our estimates:
- Identify which countries (of those you follow on AppTweak) drive the most impressions or page views on iOS.
- Access your daily device or user installs, uninstalls, store listing visitors, and acquisitions on Android in just a click.
- Get a cross-country analysis of your in-app events revenue and number of paying users on iOS or your subscription revenue on Android.
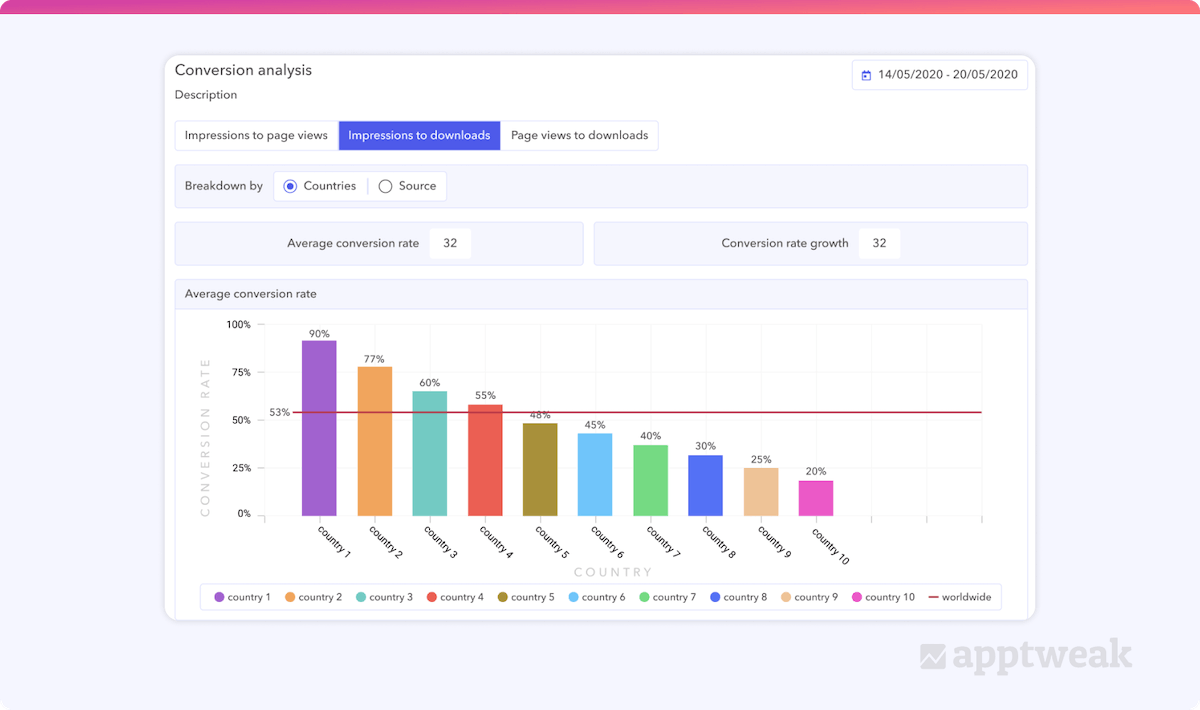
- Compare conversion rates from one country to another to understand if some countries need extra creative optimization efforts, for example. You’ll also find a breakdown by source for each country’s conversion rate so you can easily spot the countries and sources driving the most conversion.
The worldwide view is also available for Google Install keywords! This console integration allows you to select the keywords you’d like to plot on our world map and see where they drive the most traffic and installs to your app.
 Plot your Google Install keywords on the world map
Expert Tip
See that your conversion rate is lower in some countries than others? This could also be due to poor app ratings in these markets. Luckily, you can also compare your users’ opinions worldwide with AppTweak.
Prioritize work in the countries you get the most ratings
Monitoring your ratings worldwide will help you highlight the countries in which users are most (and least) happy with your app. This is extremely important, as app ratings are very visible on both stores, and the opinions of your past users definitely impact the download decisions of your future customers.
With the worldwide view, you can quickly visualize an app’s average and total ratings across countries. This provides a clear snapshot of the countries you need to prioritize first or dig deeper into.
 Worldwide total ratings for Among Us on the App Store
The example above shows us the game Among Us gets most of its ratings from users in the United States, the United Kingdom, and Russia. This could encourage the team to focus efforts on these countries first, especially if it prefers to prioritize resources for the game’s largest markets (represented by total ratings). However, considering average ratings in these 3 countries indicates some areas for concern:
 Average ratings for Among Us on the App Store
Among Us (iOS) currently has an average rating below 4 in the UK and Russia. For a leading game like Among Us, ASO strategies should be reviewed in these markets since many low average ratings in major countries could indicate bugs or a badly received app update.
Analyze your app ratings over time for your target markets
To go a step further, you can analyze your ratings across multiple countries at the same time. The cross-country analysis view allows you to quickly identify trends or irregularities in your app ratings with intuitive growth KPIs, line graphs, and cross-country comparisons.
For example, below we can visualize the new ratings gained by Among Us across select European countries over the last 90 days. From this, it is clear to see that Among Us users in the UK have given the most feedback through ratings during this period, and users in Belgium have given the least.
 Number of new ratings for Among Us across different European countries
To understand whether the new ratings gained in a country heavily impacted an app’s total ratings, you can take a look at “growth.” In the example below, we notice that new ratings for Among Us grew most in France than in other countries, comparing total ratings on the first day of the selected date range vs. the last day.
 Growth in ratings left for Among Us across different European countries
Checking the line graph below will also reveal the evolution of new ratings the app gained per day, week, or month. In this example, we see that despite the UK being Among Us’ best country in terms of new ratings, the amount of new daily ratings dropped drastically by 50% by the end of the period. This could again be something for the team to keep in mind, as we know that UK users regularly contribute to App Store ratings.
 Evolution in ratings left for Among Us across different European countries
AppTweak’s new worldwide view has been developed with the goal of upgrading your app growth on an international level!
FAQs
Why should I compare my app analytics across countries?
Comparing app analytics across countries helps you identify where your app has the highest growth potential and where performance is underperforming. Different markets behave differently in terms of app downloads, revenue, competition, and user expectations.
By analyzing metrics such as download estimates, revenue estimates, rankings, and keyword visibility by country, you can:
-
Detect high-growth markets
-
Spot declining performance early
-
Adjust ASO and Apple Ads strategies locally
-
Reallocate budget to stronger regions
Without cross-country analysis, expansion decisions are often based on assumptions rather than data-backed opportunity sizing.
What metrics should I analyze when comparing app performance by country?
Key metrics typically include:
-
Estimated app downloads and revenue
-
Category rankings and top chart positions
-
Keyword rankings and search visibility
-
Growth trends over time
Looking at these metrics side by side helps you understand not just where you perform well, but how difficult it is to compete in each country.
For a broader view of demand and competition by vertical, you can consult our report on app market size by app category, which breaks down global app revenue and download distribution across categories.
How can I track app category rankings across multiple countries?
You can track app category rankings across multiple countries by monitoring top charts and category positions for each storefront in a centralized app store analytics platform. Category rankings differ by country and can change daily based on app downloads and revenue velocity.
To track rankings effectively across markets:
-
Monitor your app’s position in specific categories per country
-
Compare how many downloads are required to reach top 10 or top 50 positions
-
Analyze ranking trends over time to detect growth or decline
-
Benchmark against local and global competitors
Using AppTweak’s Market Intlligence that aggregates top chart data across 100+ countries, enables side-by-side comparison and reduces the need to manually check each app store individually.
How can cross-country analysis improve my ASO strategy?
Cross-country analysis improves ASO by revealing how search behavior, competition, and keyword performance differ by market. A keyword that drives strong visibility in one country may be irrelevant or highly competitive in another.
By comparing keyword rankings and market dynamics:
-
You can localize metadata more effectively
-
Identify keyword gaps in specific regions
-
Adjust priorities based on competitive intensity
-
Align organic and paid efforts per country
This approach ensures ASO is tailored to local demand rather than copied globally without validation.
How do I know which country to expand to first?
The best country to expand to is where demand is growing and competition is manageable relative to your app’s positioning. Expansion decisions should balance opportunity size with competitive pressure.
To evaluate markets:
- Analyze download and revenue estimates
- Measure growth trends and seasonality
- Assess how many installs are needed to reach top rankings
- Benchmark competitor performance
AppTweak’s Market Intelligence helps quantify these factors across 100+ countries so expansion decisions are based on reliable app store data rather than intuition.
You can explore aggregated trends in our data report on app downloads by country to understand which markets drive the highest install volumes globally.
Do I need a tool to compare app analytics across multiple countries?
Yes, using a specialized app store analytics tool significantly simplifies cross-country comparison. Manually extracting data from App Store Connect and Google Play Console across multiple regions is time-consuming and difficult to scale.
A dedicated tool centralizes:
-
Download and revenue estimates
-
Country-level rankings
-
Keyword visibility data
-
Competitor performance
This enables side-by-side comparison across markets and faster strategic decisions, especially for teams managing multiple apps or global portfolios.


More articles in Product Updates

 Georgia Shepherd

