
An effective app review management strategy is essential for improving your app’s performance and driving user conversions. App ratings and reviews significantly impact your ASO and can heavily influence user decisions. Given the strong influence that ratings and reviews have on user acquisition, it’s crucial to develop a robust strategy for managing them.
In this blog, we’ll explore actionable steps to create a successful app review management strategy, allowing you to monitor and leverage reviews to boost your app’s growth, gain valuable insights, and improve user satisfaction.
1. Identify popular topics
To create a robust app review management strategy, start by identifying common themes in user feedback. One effective method is to create a sentiment word cloud, which visualizes frequently mentioned keywords in your app’s reviews. This helps you understand what users are discussing most.
With AppTweak’s Sentiment Analysis section, you can view the most repeated user opinions to really understand what was said about your app in just a few clicks.
Let’s look at Rosetta Stone as an example.
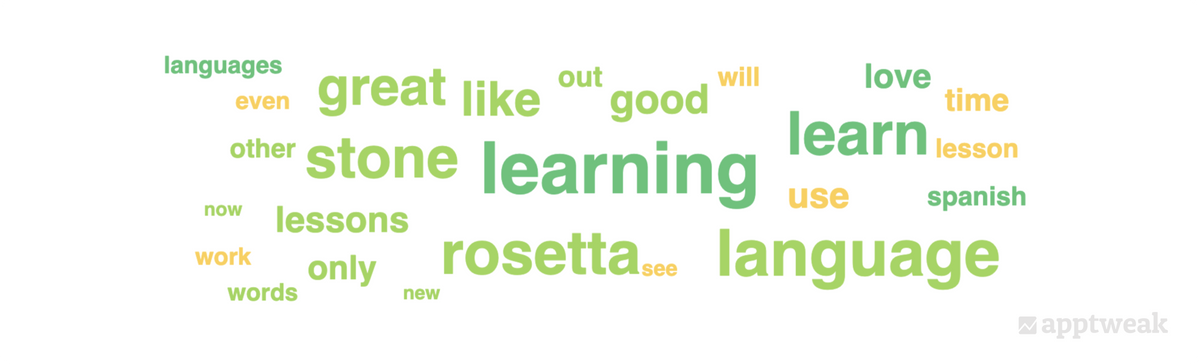
Here, we can see a word cloud with the top 25 repeated keywords and keyword phrases from Rosetta Stone’s reviews:
- The dark green words are used in mostly positive reviews
- Both positive and neutral reviews are marked by light green
- Orange words can be found in positive, neutral, and negative reviews
One of the most-repeated keywords (colored in dark green) here is “learning.” It helps us infer that users like the learning strategies used by the app.
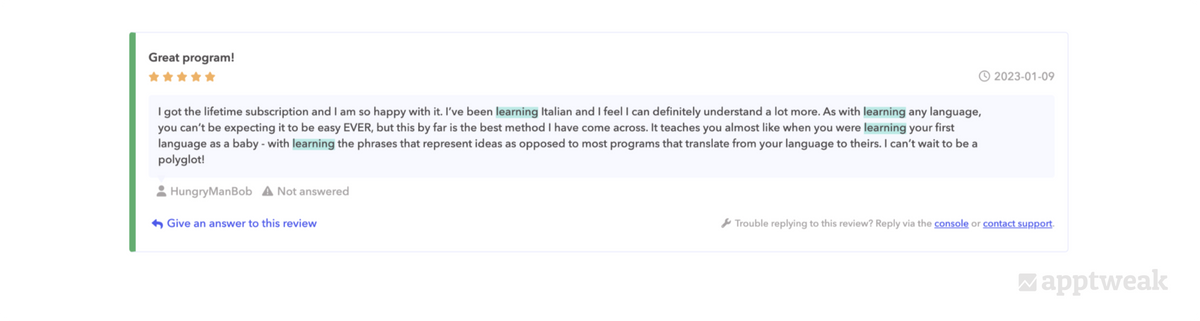
To test our assumptions, we further filtered the reviews using the keyword “learning.”
2. Dig deeper into user sentiments
Public reviews tend to be polarizing in either being overly negative or very positive. But they provide useful insights into what users like and dislike, as well as what new features users would like to see. You should never ignore negative reviews left for your app, as these leave you clues about how disgruntled users feel.
Negative reviews can be difficult to read, but these actually help you improve your app to keep users happy.
Let’s consider the example of the language learning app Duolingo.
Learning from user feedback: The case of Duolingo
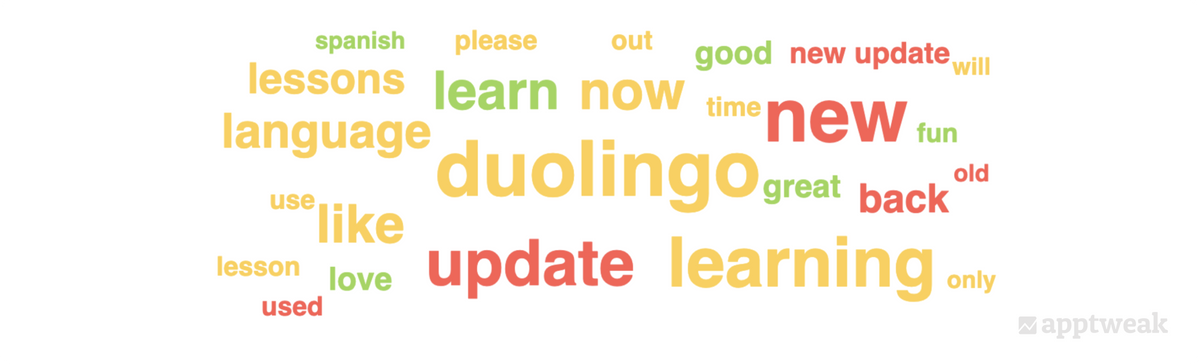
On AppTweak, we observed many moderate and negative reviews for Duolingo. The most-repeated words in these reviews were “new” and “update,” indicating dissatisfaction with recent updates.
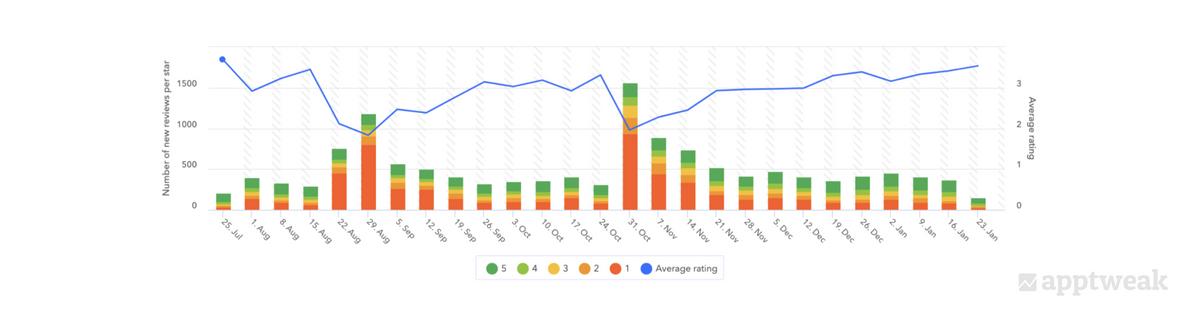
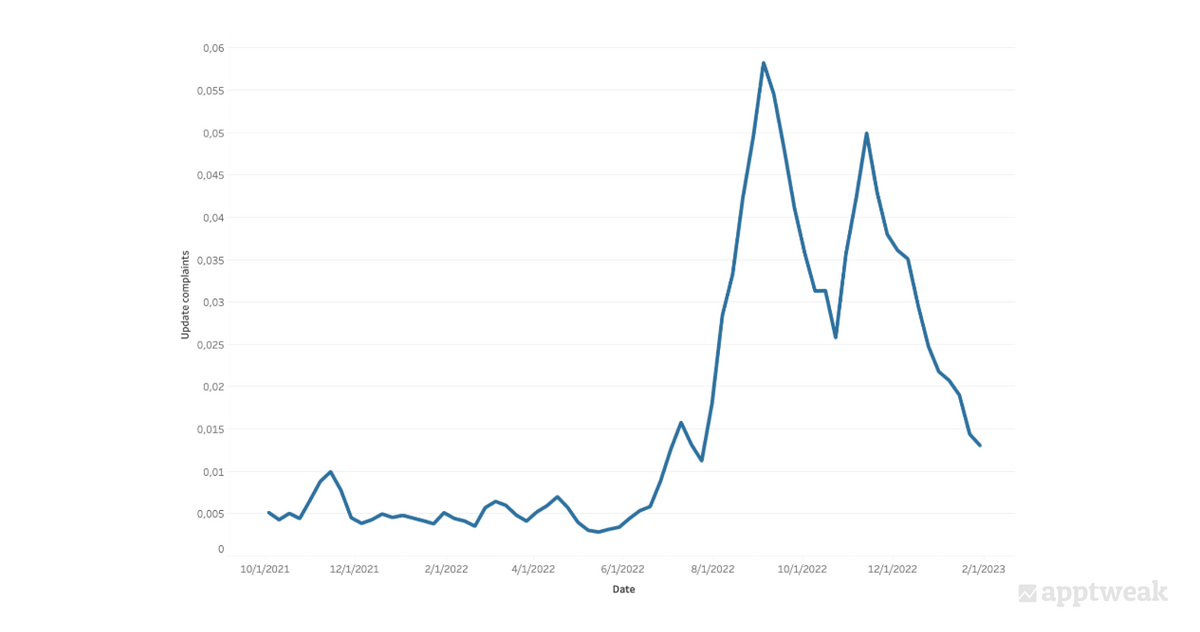
Spikes in negative reviews followed version updates on August 15 and October 24, suggesting these changes were not well-received. Our data science team conducted a topic analysis to identify common review topics, filtering out irrelevant keywords.
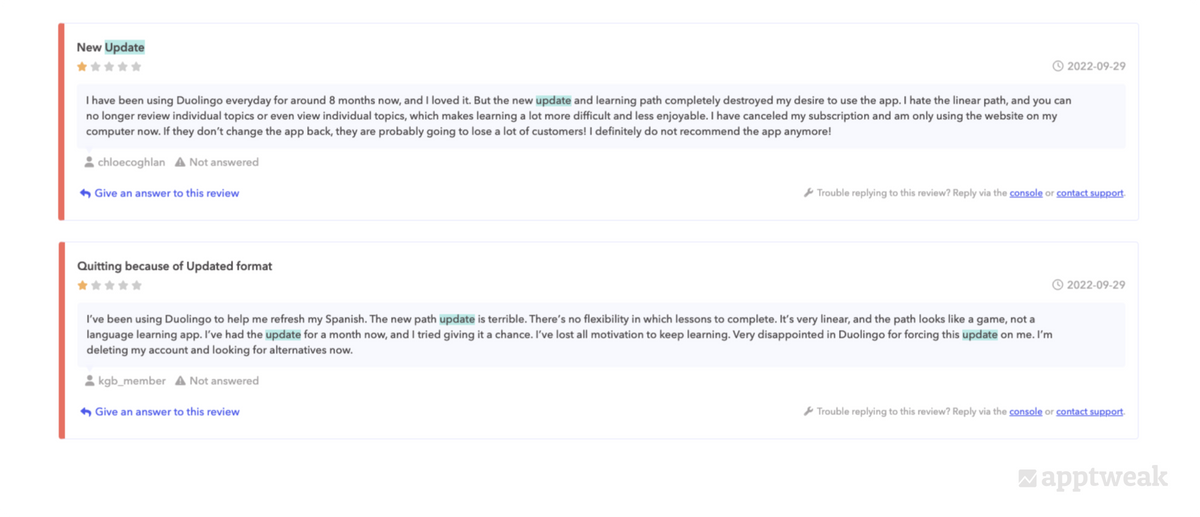
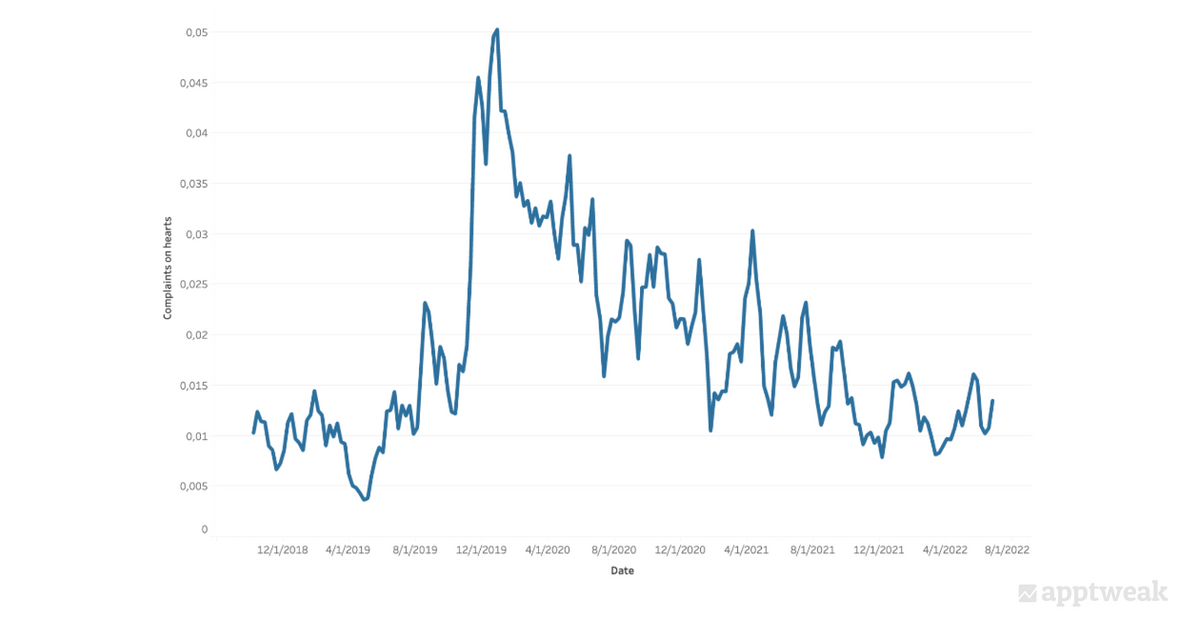
Users frequently complained about the new layout and learning format introduced in the updates. Keywords like “update,” “new,” “path,” “layout,” “change,” and “format” were prominent. A similar issue occurred in 2019 with the introduction of a “hearts” system, leading to a surge in negative reviews.
Learn how you can leverage our data science to run a similar analysis for your app or game
In short, negative reviews are just as important to manage as positive ones. It gives you an opportunity to fix the things that users are not happy with and to detect interesting topics.
Uncover interesting insights to improve how users perceive your app
3. Personalize responses when replying to app reviews
Responding to reviews (good or bad) is important to maintain a strong relationship with your users. About 57% of users claim they wouldn’t be very likely to use a product or a service that doesn’t care to respond to reviews.\
You can improve your app’s conversion rate by responding to reviews, as the majority of consumers report that they would be more likely to install an app if the reviews have been responded to.
In addition, don’t forget that users can edit their reviews. When you respond to negative reviews and resolve the issues, you may find that users appreciate the effort enough to edit their reviews and increase their star ratings.
Follow these best practices when replying to app store reviews
Personalizing your responses is a key component of your app review management strategy and fosters trust and loyalty. We recommend replying with a user’s name in the response and to thank them for taking the time to leave a review, whether it’s a 1-star review or a 5-star review.
Let’s look at the language app Busuu as an example. This personalized response mentions the user by name, thanks the user for writing a review, apologizes for any inconvenience, assures the user that the issue is being resolved, and offers support in the meantime.

Leverage AppTweak’s App Reviews Manager to reply to reviews across multiple apps and countries
4. Optimize your ratings prompt
You need to plan how to help your happiest users rate your app.
A strategy to combat negative review bias is essential because your satisfied users are unlikely to go out of their way to organically rate your app. While happy users rarely take the time to write a glowing review, upset users immediately turn to app store reviews as a place to vent, ask for support, and warn other users about issues within your app.
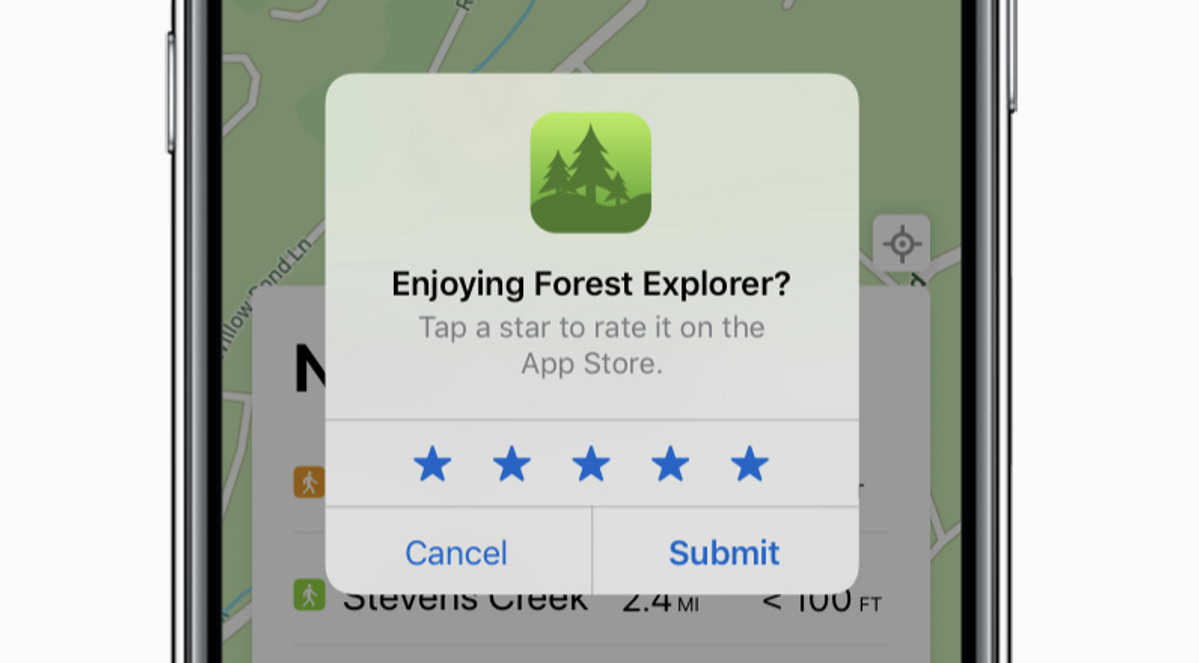
A great strategy to minimize negative reviews is to set up in-app prompts that ask users for feedback at an optimal time.
What to consider before implementing in-app rating prompt?
Before setting up in-app ratings prompts for user feedback, consider these key points:
- Don’t ask for a rating or review at onboarding. Give users a chance to familiarize themselves with your app first. To increase the likelihood of receiving a positive rating or review, consider the best place to ask for feedback. This could be when a user has completed a level of your game, when a user has placed a successful order, or after rewards points have been redeemed.
- Avoid interrupting people. Asking for feedback when a user is in the middle of gameplay or completing an important task can be annoying and even cause them to leave a lower rating. Setting prompts to appear during breaks in gameplay or after a task is completed is less intrusive and can help you to receive more honest feedback.
- Don’t pester your users. Asking users for feedback too frequently can diminish their opinion of your app. Try to wait at least a couple of weeks between prompts, so users don’t feel annoyed when leaving a rating or review.
TL;DR
Ratings and reviews are a goldmine of customer feedback for apps and games on the app stores. Creating an effective app review management strategy can help you gauge valuable feedback from your consumers as well as maintain a strong relationship with your users.
- Assess popular topics to discover what users like and dislike about your app. This gives you the ability to continue making improvements to your app/game.
- Negative reviews are just as important as positive ones. Negative reviews allow you to learn about users’ pain points so you can solve their frustrations.
- Try personalizing your responses when replying to a review. Engaging with a user will make them feel valued and increase their trust in you.
- Optimize rating prompts to encourage users to give feedback. However, be careful not to repeat the prompt in a manner that could irritate users.
Want to learn more about optimizing your app/game’s reviews and ratings? Schedule a demo today!


More articles in Reviews and Ratings

 Oriane Ineza

 Georgia Shepherd
