
Reporting isn’t slow because of the data. It’s slow because of everything that comes before it.
Creating spreadsheets, building dashboards, and aligning metrics across teams. This is where app store reporting often breaks down.
Even AppTweak’s in-house consultants used to spend hours rebuilding Looker dashboards and fixing exports whenever something changed.
And once the data was ready, they still had to figure out what it actually meant.
That’s why we built Reporting Studio.
It’s an app store reporting tool built specifically for ASO and growth teams to build dashboards, monitor performance, and understand what’s driving results.
With pre-built templates, an AI-powered dashboard builder, and one-click analysis, it’s the easiest way to get from data to clear insight.
Key takeaways
- App store reporting is often slow due to manual exports, fragmented tools, and misaligned metrics across teams.
- Reporting Studio centralizes App Store, Google Play, and MMP data into custom dashboards.
- AI-powered reporting reduces setup and analysis time by generating dashboards from simple prompts.
- AI Performance Insights explain changes, surface trends, and recommend next steps with less manual analysis.
The challenge with app store reporting today
App store teams already have most of the data they need. The challenge is turning it into something teams can align on and act on.
Different teams track different metrics, use different tools, and define success differently. This often leads to dashboards that aren’t used, reports that take hours to rebuild, and more time spent setting things up than improving performance.
Reporting Studio helps you bring everything together:
- Centralize your data: Report on App Store, Google Play, and MMP data in one shared dashboard
- Build dashboards with AI: Describe what you want to analyze, and let Reporting Agent build it in seconds
- Analyze performance instantly: Performance Insights reads your full dashboard and surfaces trends and next steps
Build app performance dashboards with Reporting Agent
When you need a quick dashboard, start with Reporting Agent.
Part of AppTweak AI Agents, it lets you describe what you want to analyze and get something you can tweak or use right away.
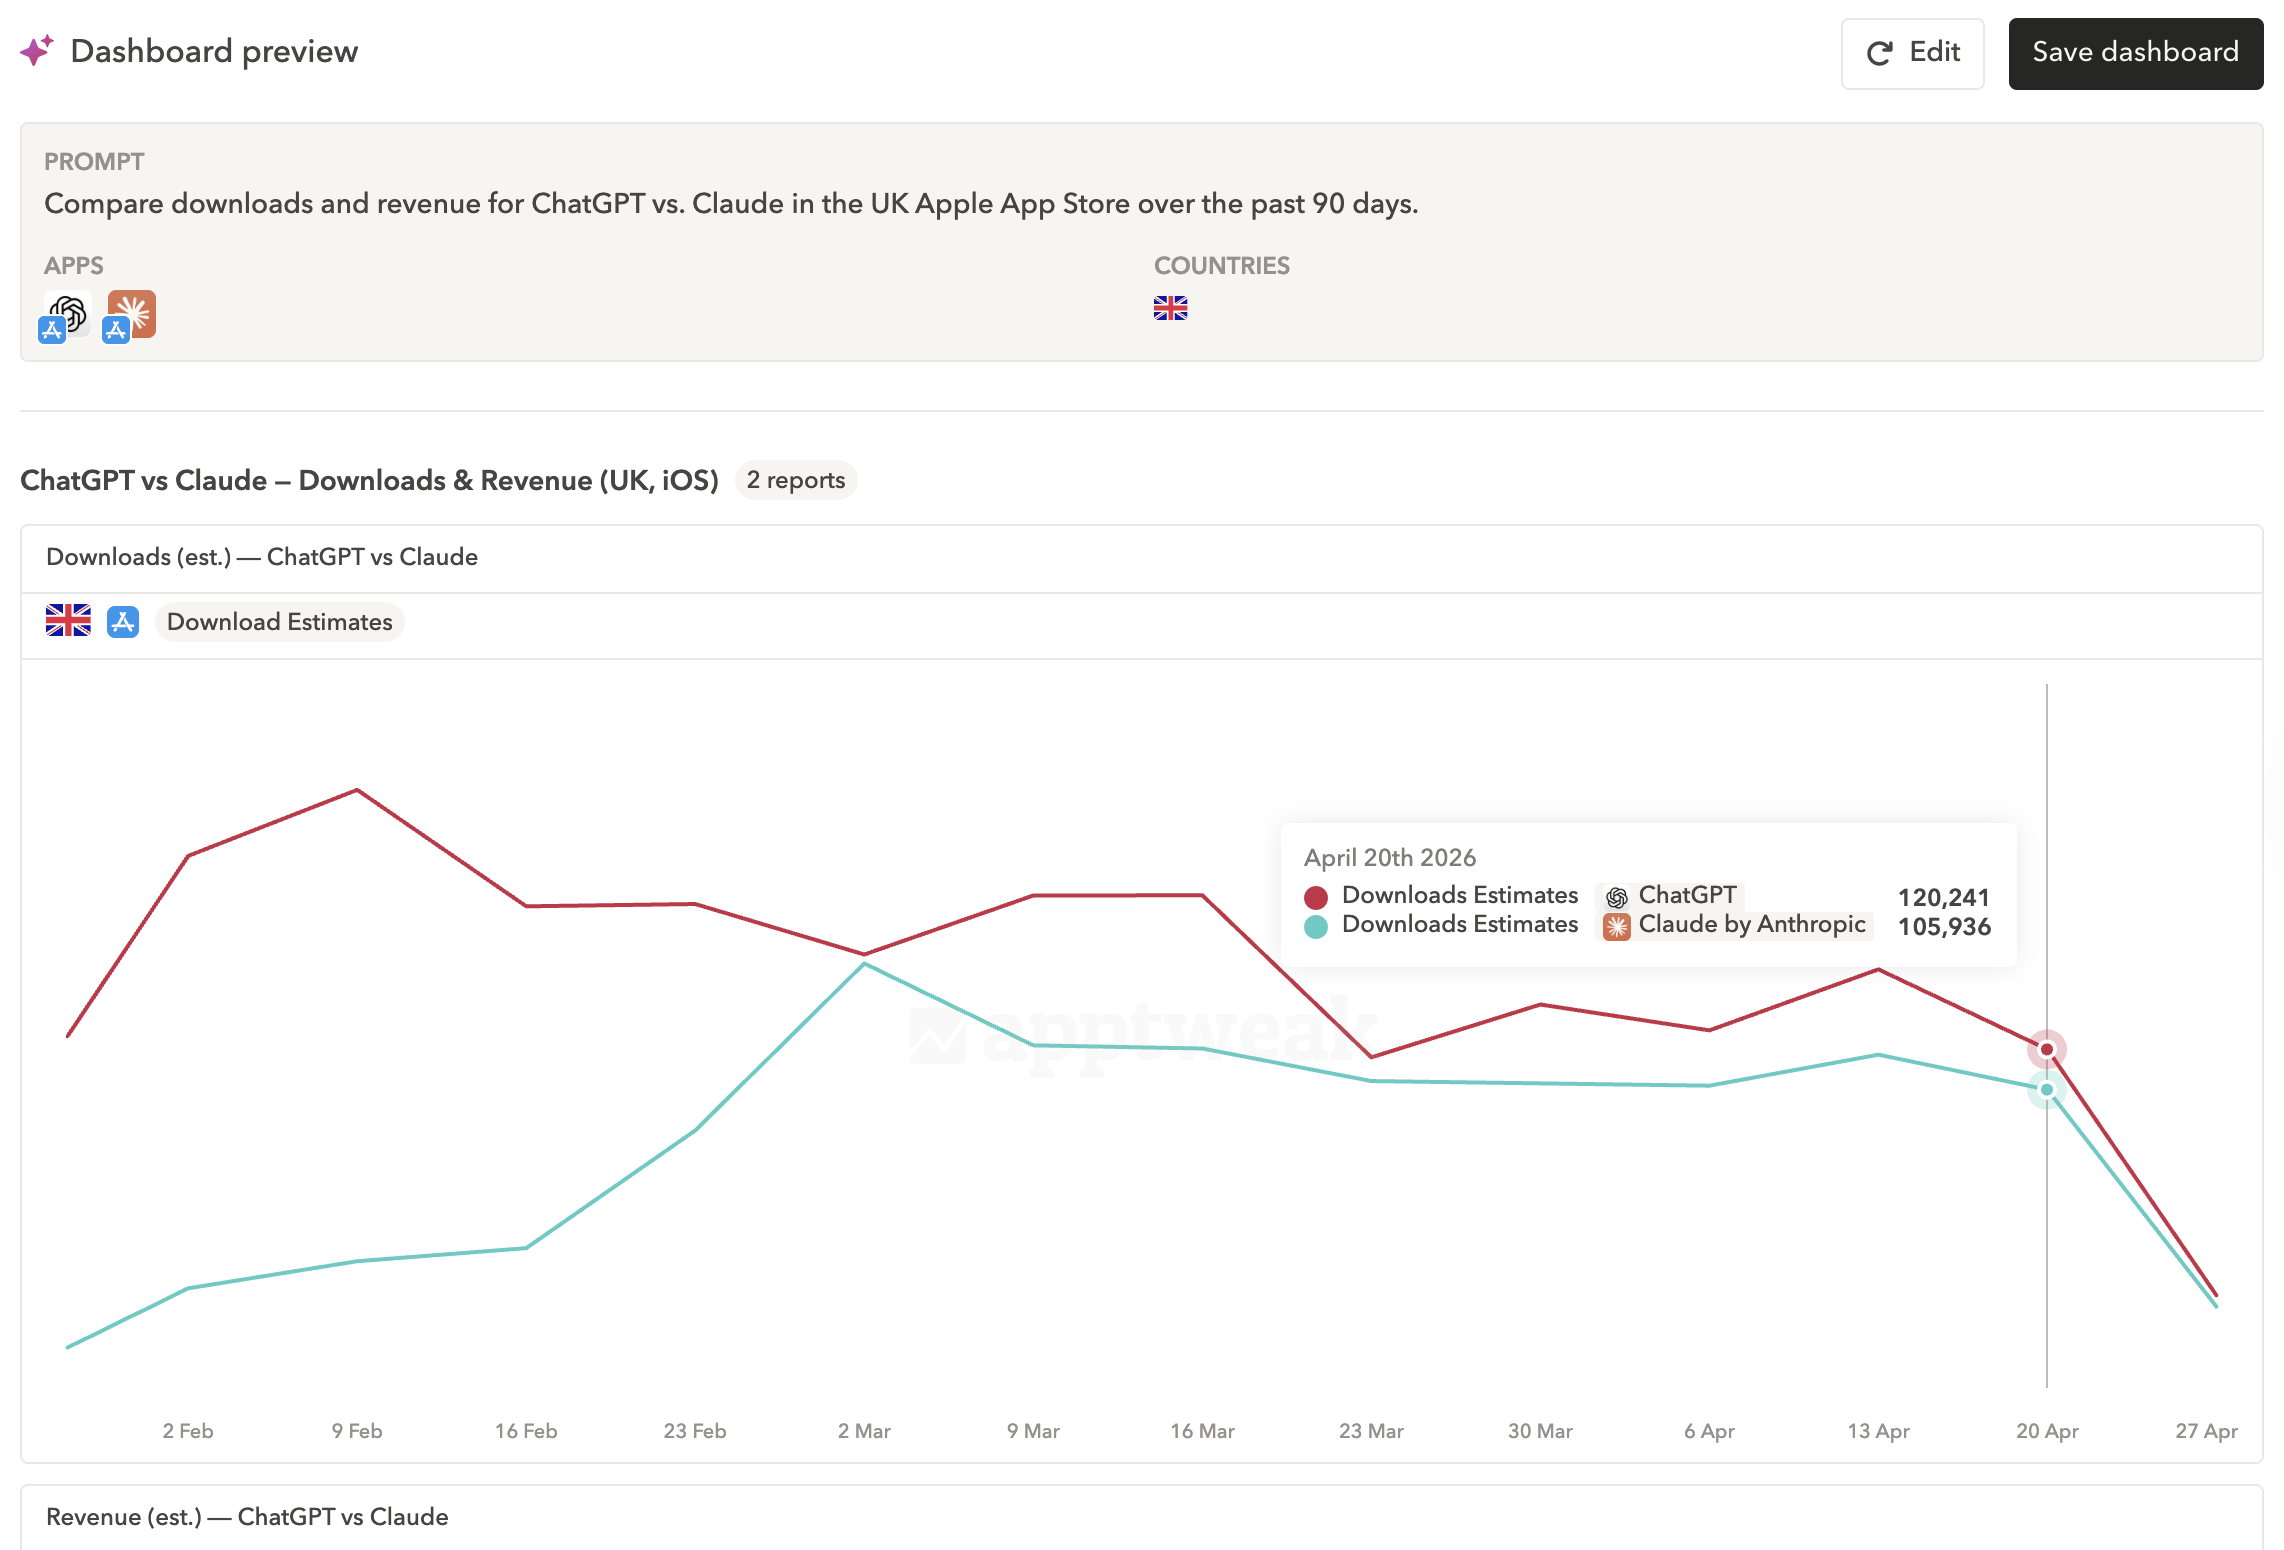
For example, your manager asks how your app is performing compared to a competitor – and you need something to share in your next sync.
✍️ Just copy, paste, and adapt this prompt: Compare downloads and revenue for ChatGPT vs. Claude in the UK Apple App Store over the past 90 days.
You get a clear view of performance, without building from scratch.
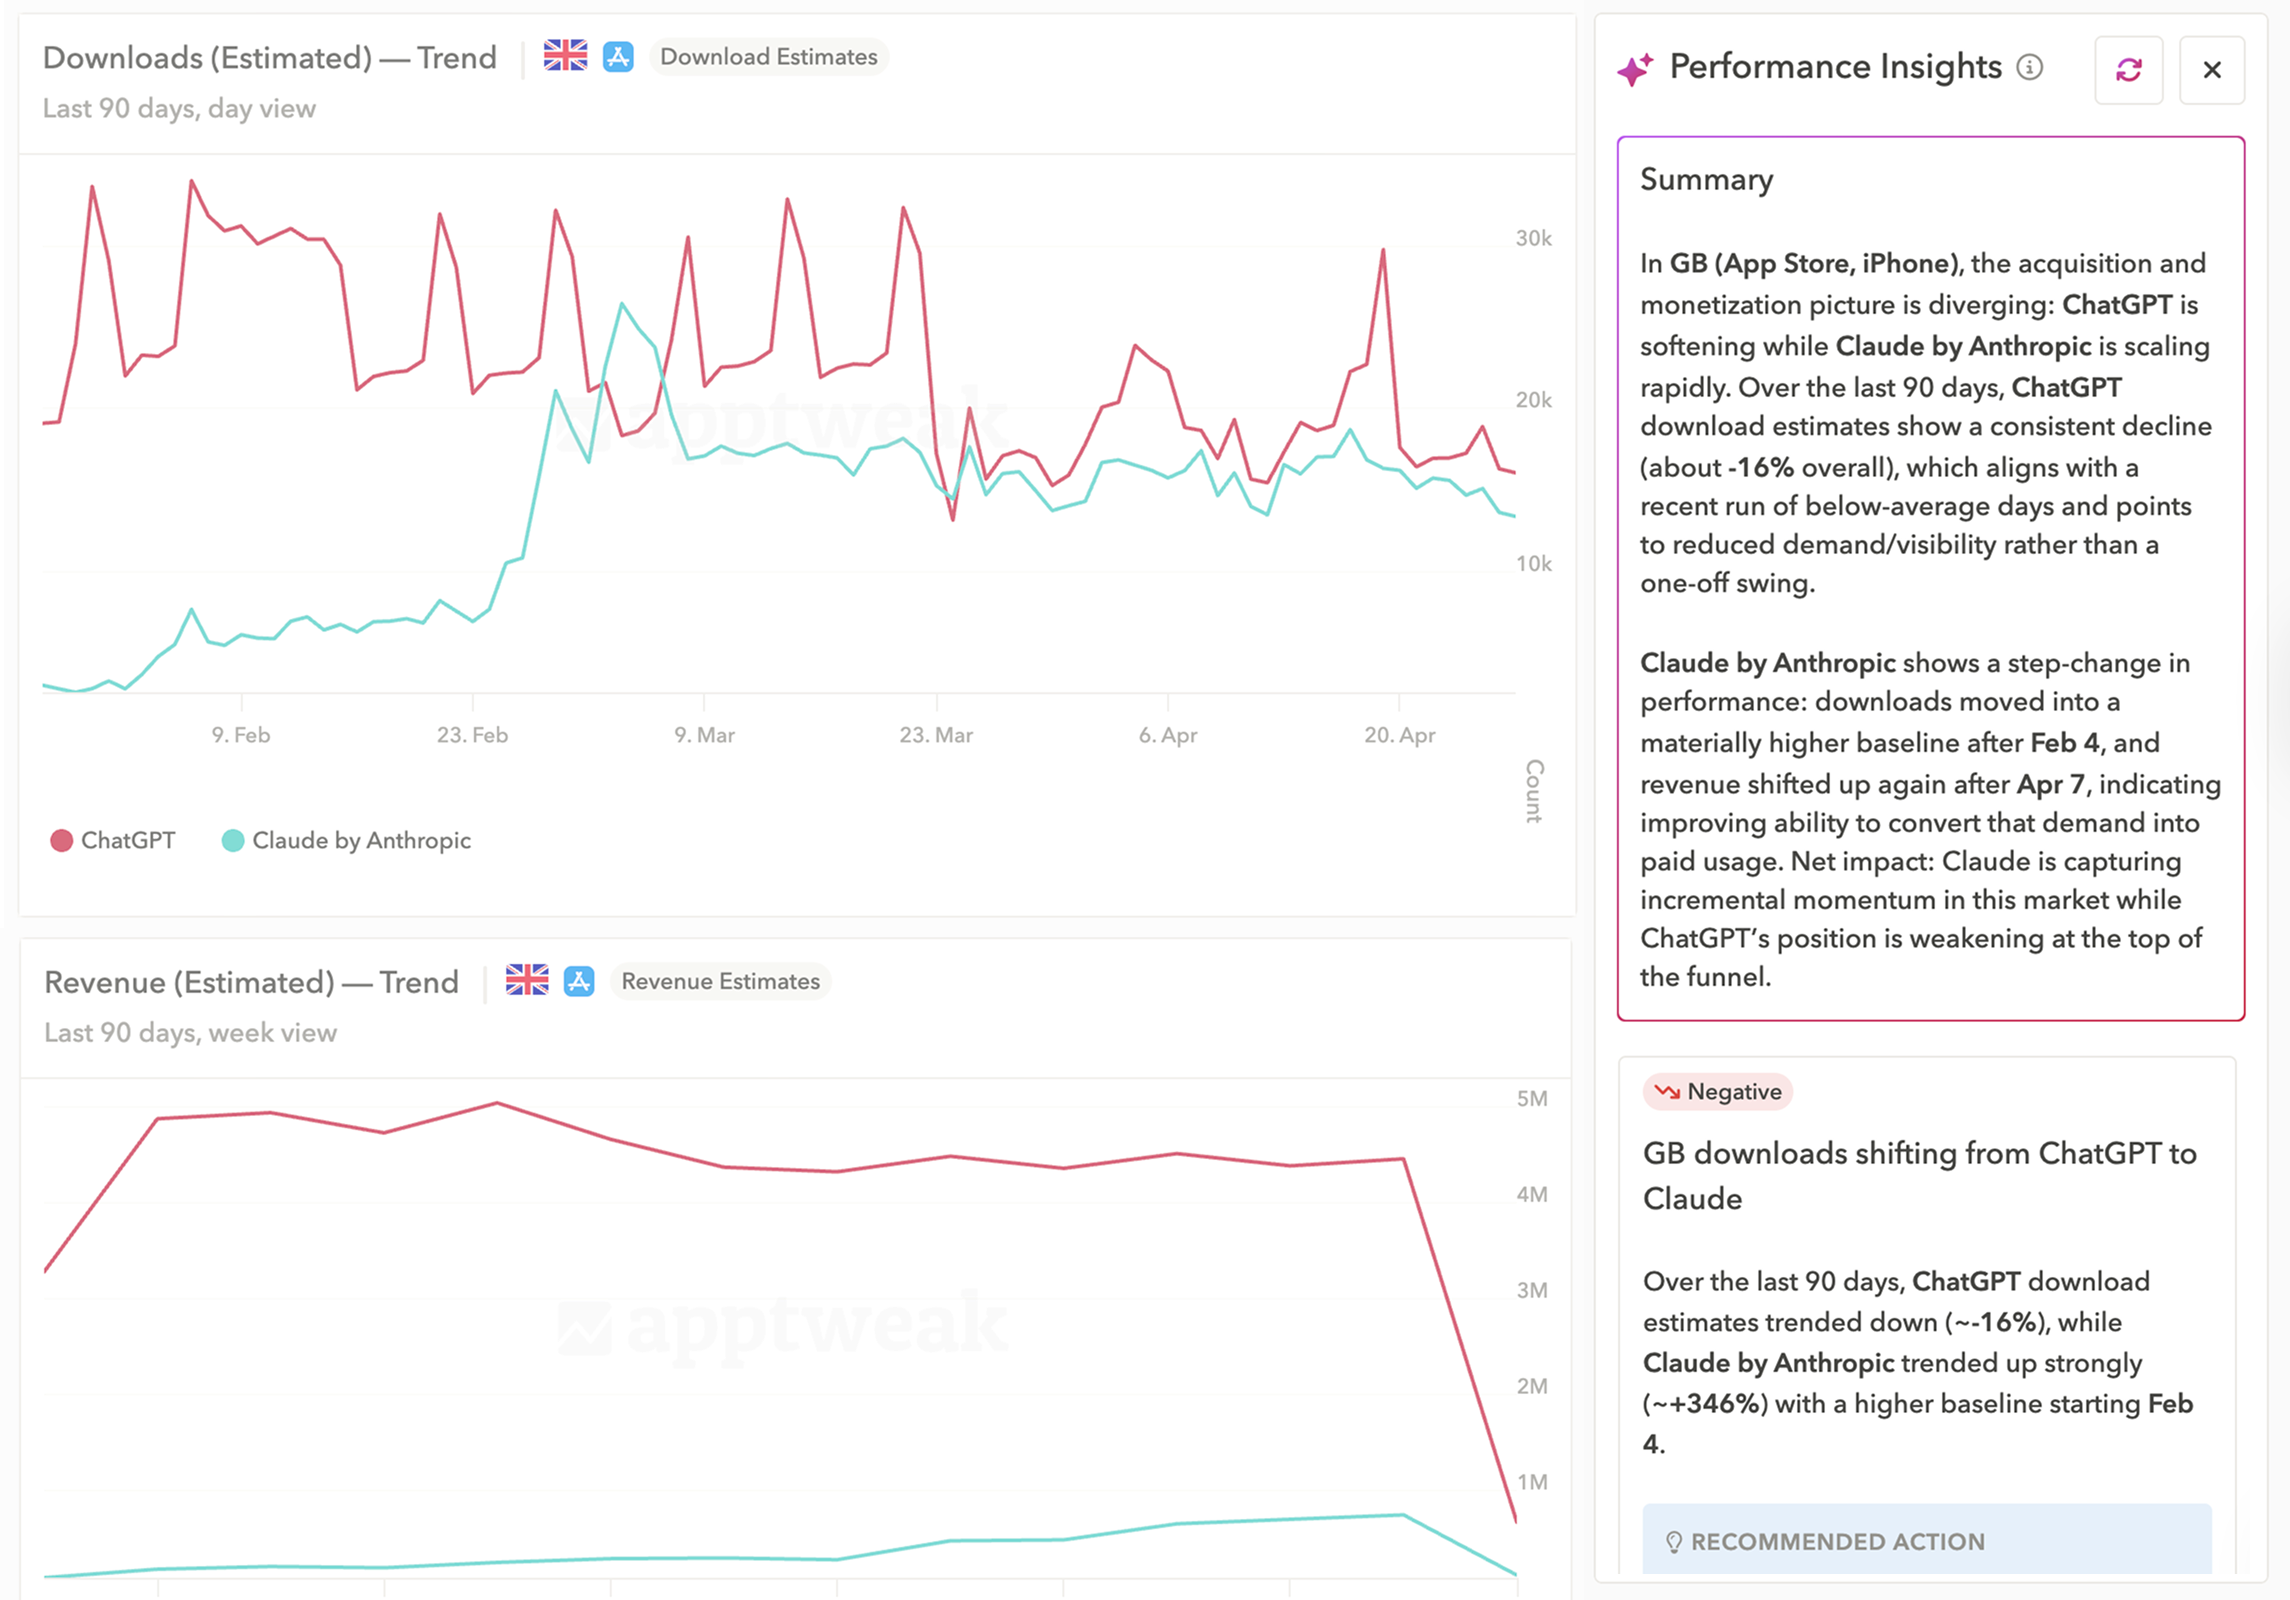
Building the dashboard is step one. Understanding what changed and what to do next is where a lot of time goes.
With Performance Insights, you get:
- A plain-language summary of your performance, ready to drop into slides
- Key trends across your data
- Recommended ASO actions to take next
In one click, Reporting Agent reads your entire dashboard and connects the dots for you, so you spend less time interpreting and more time acting.
The four dashboards every app store marketing team needs
If you’re not sure what to track, below are the dashboards our consultants rely on most to report on ASO impact.
Each one has a dedicated pre-built template in Reporting Studio. Just connect your console to get started.
🎥 Watch the replay of Office Hours: Mastering ASO Dashboards for more reporting tips and tricks
1. ASO Manager Dashboard: Monitor the metrics you influence
Best for: ASO specialists managing metadata, creatives, and app store performance.
Purpose: Track the metrics ASO teams can directly influence (how well you’re attracting and converting organic traffic).
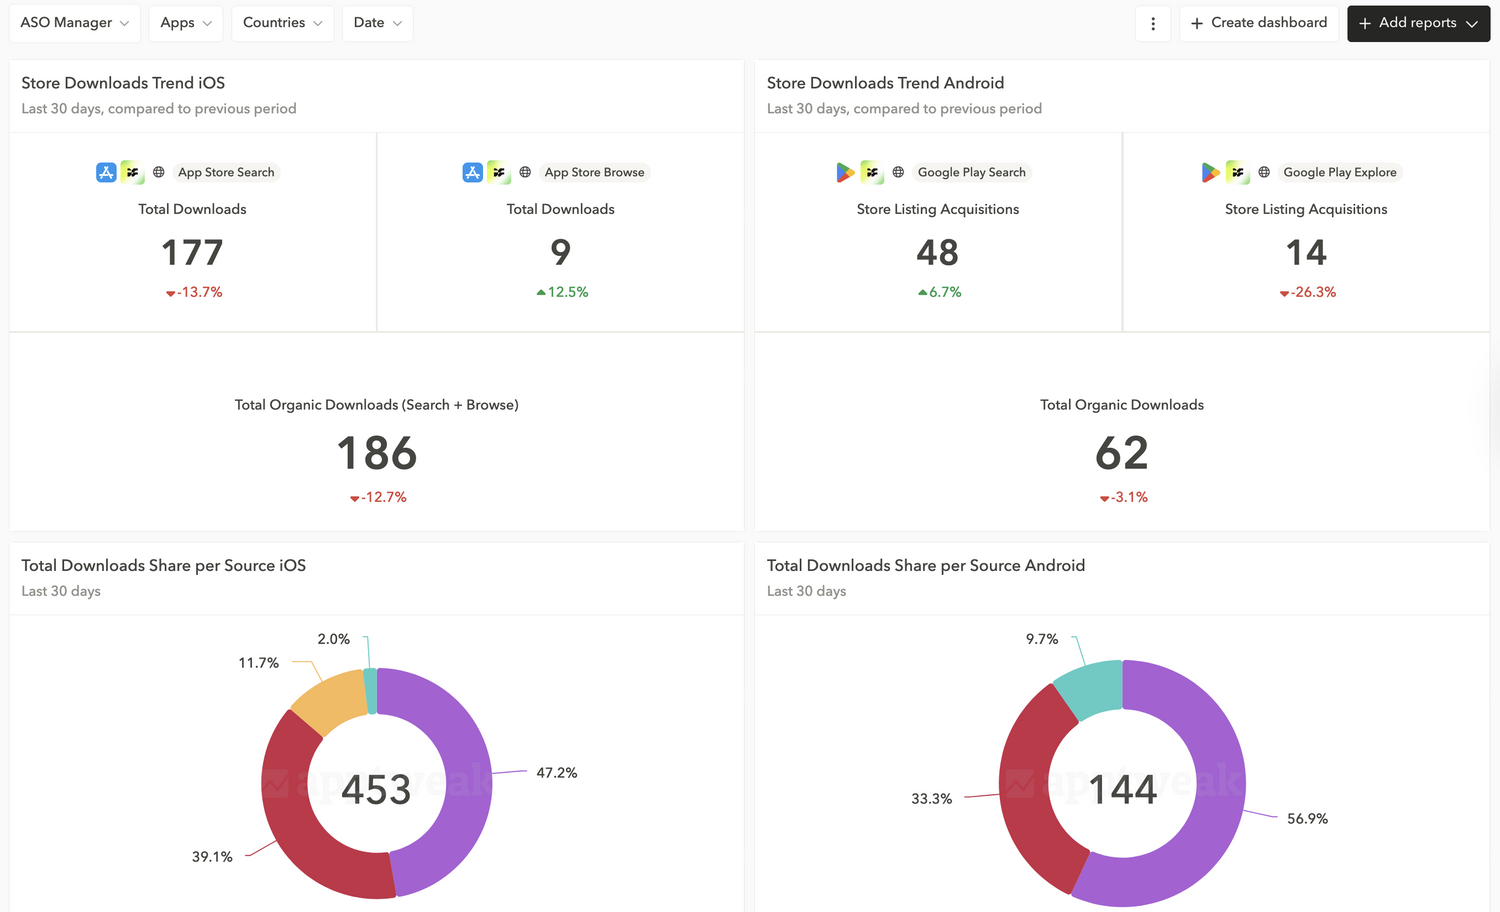
Key reports and what they tell you:
- Downloads from search + browse/explore: The first question an ASO manager gets is often, “How many downloads came from your work?” This dashboard helps you track core organic performance.
- Download share by source: Understand how much of your total installs come from organic. A drop may signal another channel growing faster or a decline in organic.
- Impression share by source: Compare traffic share (impressions) to install share. High organic impressions but low installs could indicate low conversion.
- Conversion rate by source: Remember that conversion = installs ÷ impressions. Use these reports together to identify potential issues with your strategy.
Expert Tip
On Google Play, search and explore can overlap. Combining both helps you avoid misreading performance.2. Head of Growth Dashboard: Track acquisition & monetization
Best for: Growth leads, UA managers, and performance marketers
Purpose: Align acquisition channels and user behavior with installs and revenue.
Key reports and what they tell you:
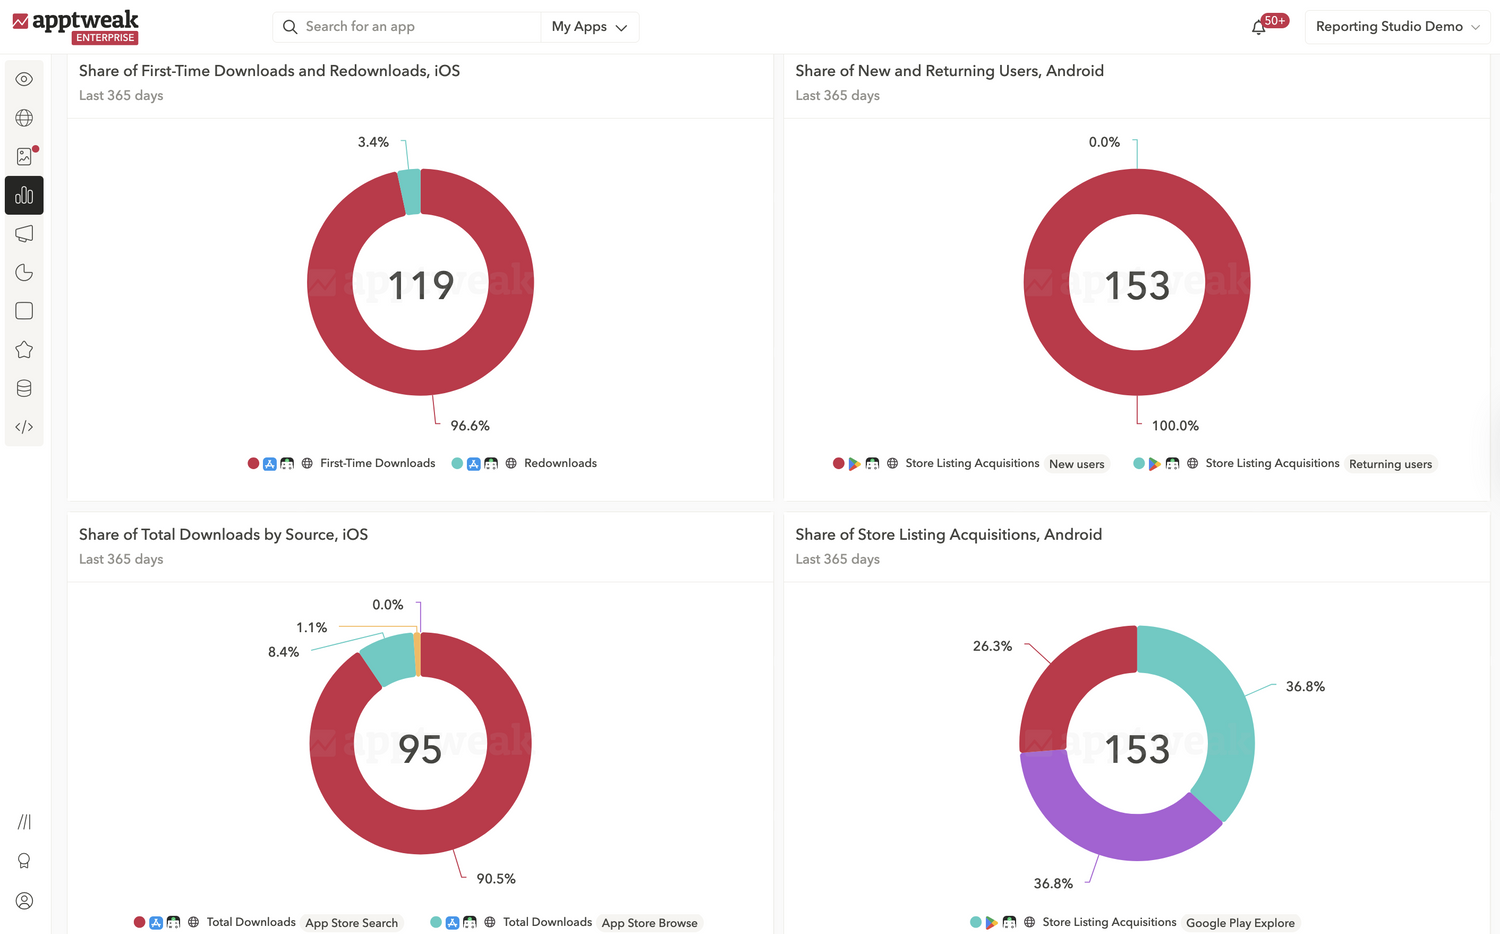
- Share of store vs. external downloads: Monitor how much of your growth comes from within the app stores vs external campaigns.
- Share of new vs. returning users: Understand user mix. There’s no “best” ratio here: early-stage apps should prioritize first-time installs; mature apps often drive more redownloads.
- Download share by source: Align UA and ASO teams on where growth is coming from and where you want to scale efforts.
- Downloads vs. sales: If installs are growing but revenue isn’t, assess whether it’s an expected part of your strategy or if you’re acquiring fewer high-value customers.
Expert Tip
Adding MMP data helps break down referral traffic into specific channels like TikTok or Meta.3. Executive Dashboard: Provide clear, strategic performance insights
Best for: CMOs, VPs, and cross-functional leadership
Purpose: Leadership doesn’t want every metric – they want direction. Surface high-level performance, trends, and areas that require action.
Key reports and what they tell you:
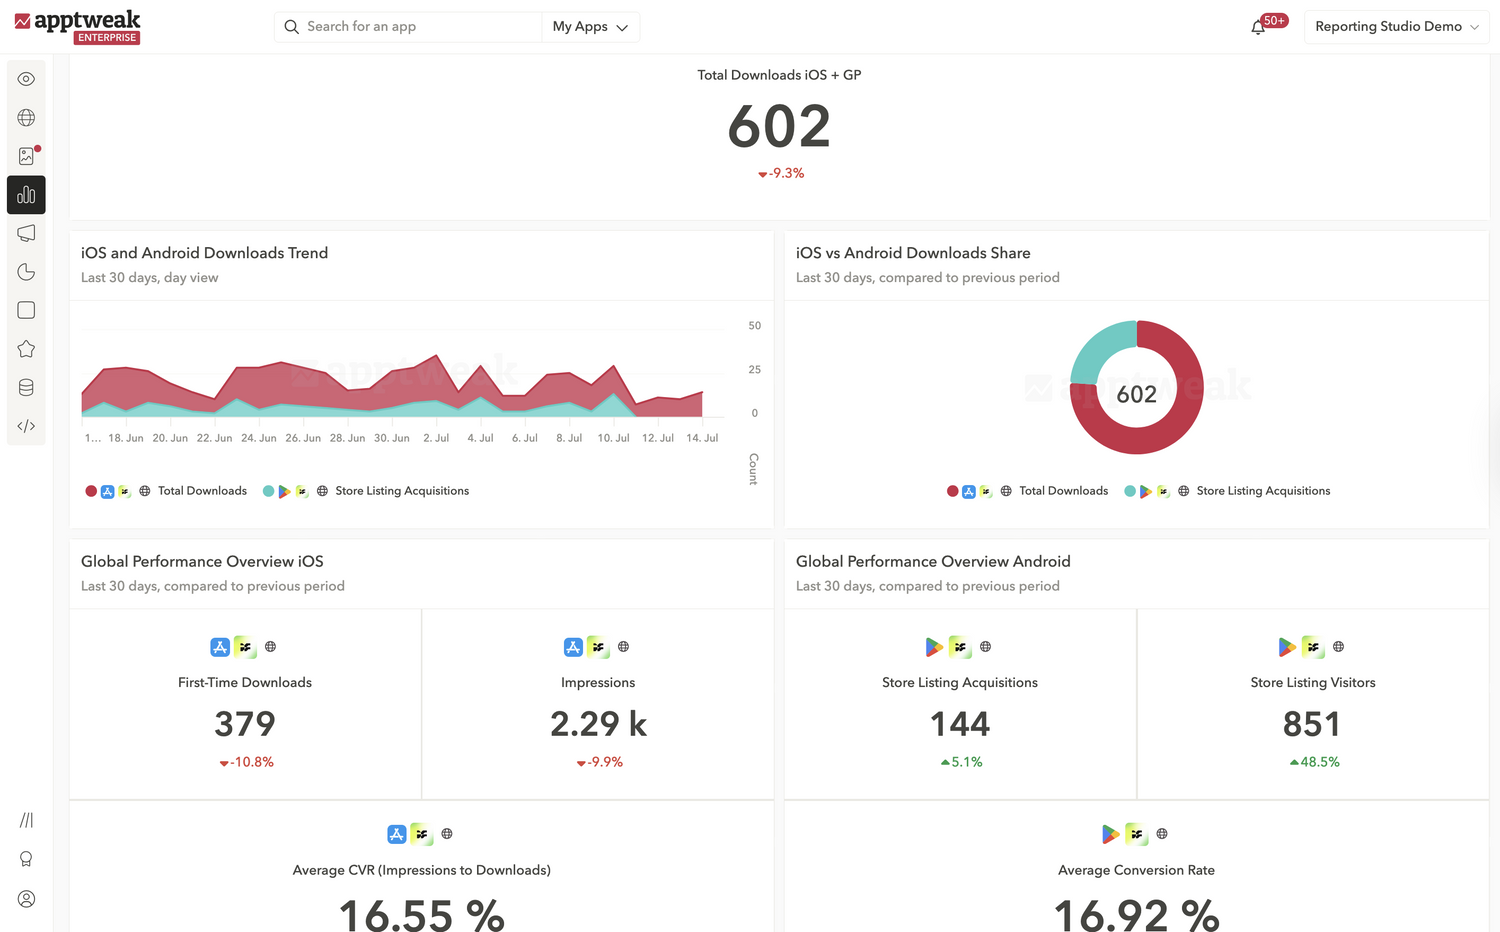
- Total downloads on both stores: Get the big picture of your performance across both stores combined, and spot unusual spikes or drops.
- Download trends and share: Understand how each store contributes to growth. Useful for setting OKRs or adjusting budgets.
- Performance overview: Track whether growth comes from more visibility (impressions), a lift in installs, or better conversions.
- Store vs external downloads: Spot shifts between ASO and paid UA performance.
Expert Tip
Use custom metrics to isolate true organic performance (e.g., adding search + browse together).4. Competitive Analysis Dashboard: Benchmark against the market
Best for: ASO teams, UA leads, and product marketers tracking competitors
Purpose: Growth isn’t just about your own numbers. While the first three dashboards rely on your console data, this dashboard is powered by mobile market intelligence to monitor competitor trends that could affect your growth.
Key reports and what they tell you:
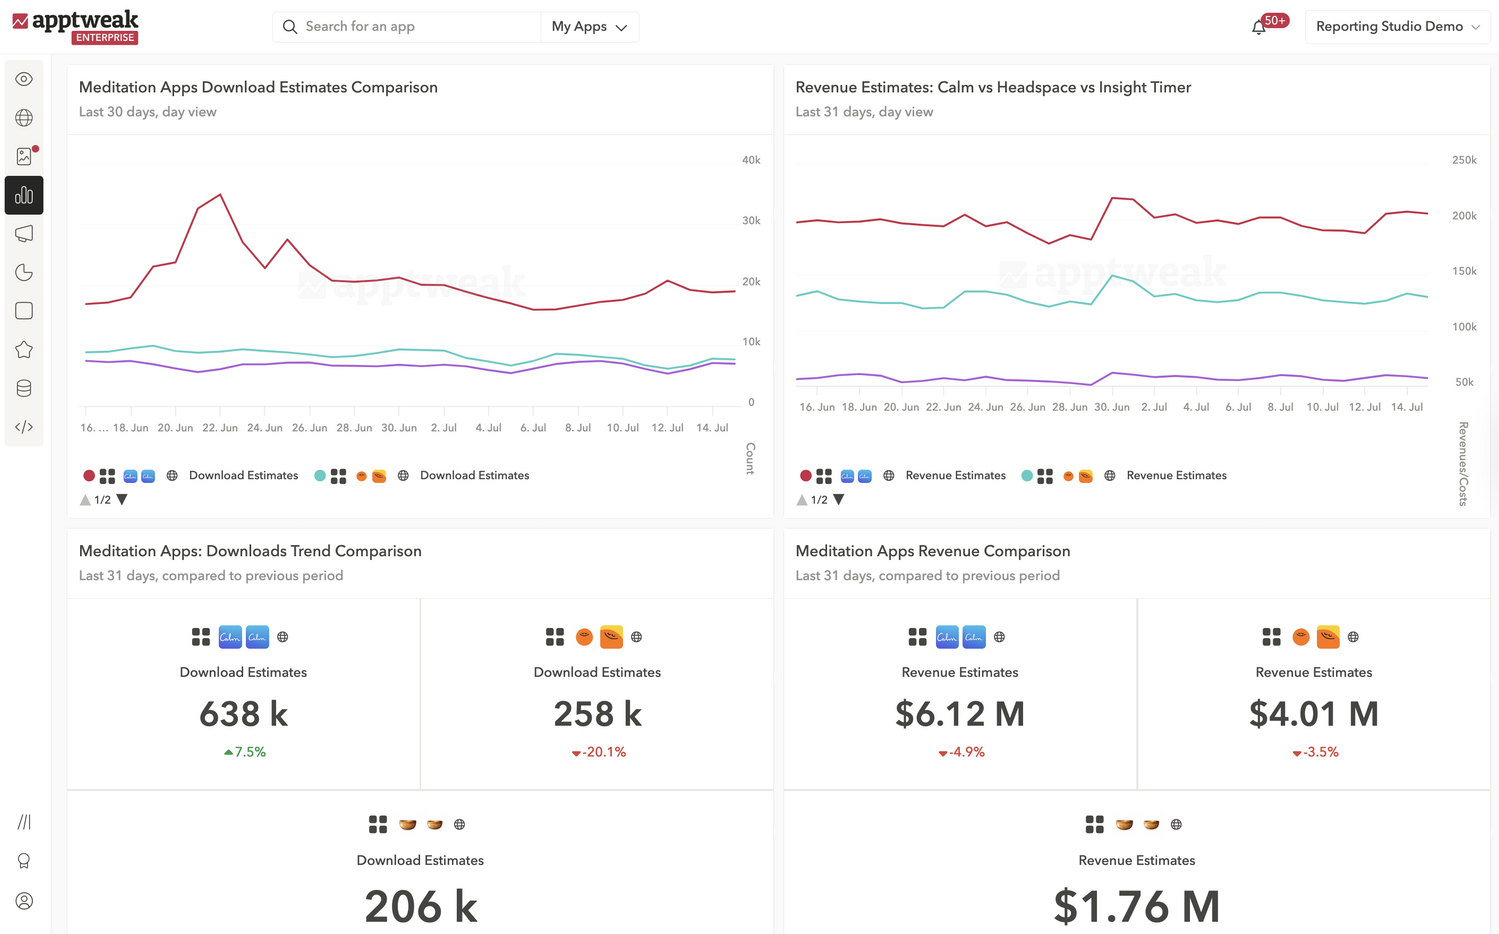
- Download and revenue trends: Spot changes in competitors’ downloads and revenue performance early.
- Download and revenue growth: Compare how fast you’re growing vs competitors in key markets.
- Download and revenue share: Know who dominates market share over time.
Expert Tip
If a competitor’s performance spikes, investigate their ASO updates, localizations, or new market launches.How to approach app store reporting
There are two main ways to approach app store reporting. Reporting Studio supports both:
- Monitoring: Track the same KPIs regularly to catch changes early. Each dashboard template is designed for daily performance checks.
- Investigating: When performance shifts, use Reporting Agent to explore your data and understand why faster.
Regular monitoring helps you catch changes early. Investigating tells you what’s causing them.
Avoid these common reporting mistakes
Many teams fall into the same traps when reporting on app store performance. Here’s how to avoid them and save hours every week:
- Reporting in isolation: If your dashboard only makes sense to you, it won’t drive action. Add context and keep the story clear.
- Too many reports, too little insight: More isn’t always better. Focus on reports that support decisions.
- Misunderstanding metrics: Not all data points are calculated the same way. For example, Apple Ads reports total impressions, while App Store Connect reports unique impressions.
-
Assuming everyone speaks the same language: “Organic” or “referral” can mean different things across teams. Use dashboards to align on definitions.
Conclusion
The fastest way to improve your reporting is to make it easier to understand and act on.
With Reporting Studio, you can:
- Build app performance dashboards in seconds
- Align teams on the same metrics
- Show exactly what’s driving your growth
Start by generating your first dashboard with Reporting Agent – now available for all AppTweak users.
FAQs
Why is app store reporting manual and time-consuming?
App store reporting is slow because teams rely on manual exports, spreadsheets, and disconnected tools. Data is spread across App Store Connect, Google Play Console, and MMPs, which forces teams to rebuild dashboards and align metrics repeatedly.
This creates three main bottlenecks:
- Manual data aggregation across sources
- Rebuilding dashboards for recurring reports
- Misaligned definitions between ASO, UA, and leadership
By the time reports are ready, the opportunity to act on performance changes is often missed. Reporting Studio solves this by centralizing all data into one dashboard, without needing exports or spreadsheets.
How do you report on app performance with AI?
You can report on app performance with AI by generating dashboards from simple prompts in AppTweak. Instead of building reports manually, teams can describe what they want to analyze and get a ready-to-use dashboard in seconds.
With Reporting Agent in AppTweak, AI:
- Builds dashboards from natural language prompts
- Analyzes the full dataset to identify trends and anomalies
- Explains what changed and why across metrics
- Recommends next ASO or growth actions
This replaces both dashboard creation and manual analysis, reducing reporting time from hours to minutes while improving decision-making.
What are the best tools for app store reporting and dashboards?
The best app store reporting tools combine data centralization, no-code dashboards, and AI-driven insights. Tools should not only visualize metrics but also explain performance and guide decisions.
AppTweak’s Reporting Studio stands out by offering:
- Unified dashboards across App Store, Google Play, and MMP data
- AI-generated dashboards from simple prompts
- Performance Insights that explain trends and recommend next actions
- Shareable dashboards that keep teams aligned
This allows teams to go from raw data to insight without manual analysis. Unlike generic BI tools, it is built specifically for app store marketing, making insights directly usable for ASO and growth teams.
When should you switch from manual to AI reporting?
Teams should switch to AI reporting when manual workflows slow down analysis or create inconsistencies across teams. This typically happens as reporting complexity increases.
Common signals include:
- Managing multiple apps, markets, or acquisition channels
- Spending hours building or updating dashboards
- Difficulty aligning metrics across ASO, UA, and leadership
At this stage, manual reporting limits speed and clarity. AI-powered tools like AppTweak’s Reporting Studio standardize reporting, surface insights faster, and help teams act on performance changes in time.
How does AppTweak Reporting Studio help ASO and growth teams?
AppTweak’s Reporting Studio helps teams build dashboards, monitor performance, and understand what drives results without manual reporting. It combines centralized data with AI-powered analysis to make reporting actionable.
Teams use Reporting Studio to:
- Track ASO and growth metrics across all data sources in one place
- Build dashboards instantly using Reporting Agent
- Automatically identify trends, explain performance changes, and recommend next steps
- Share dashboards with stakeholders to align on metrics and decisions
This makes reporting faster, clearer, and easier to scale, helping teams move from data to action with confidence.


More articles in Advanced ASO, Product Updates, Start ASO

 Georgia Shepherd


 Oriane Ineza