Reasons to Connect Your Apple & Google Console
 by Marie-Laure Cruyt
CPO at AppTweak
— 8 min read

You are probably aware that it is possible to connect your App Store and Google Play Store consoles to your AppTweak account, but are you aware of the benefits of doing so? Whether you’ve already synced your console or not, in this article, we highlight all the unlocked features you gain access to once you connect your console to your AppTweak account.
Unlock extra features on AppTweak
1. Import all of your apps in just a click
Getting started with ASO is not an easy task. You first need to set up your ASO dashboard by adding the apps you want to work on in the markets you’re focusing on. This can be a tedious process if you have many apps worldwide.
If you connect your Apple or Google console to AppTweak, we’ll directly access all the apps of your console and load them into AppTweak. You’ll find the list of all the apps of your account and the countries where they are available in the “Integrations” tab of your dashboard.
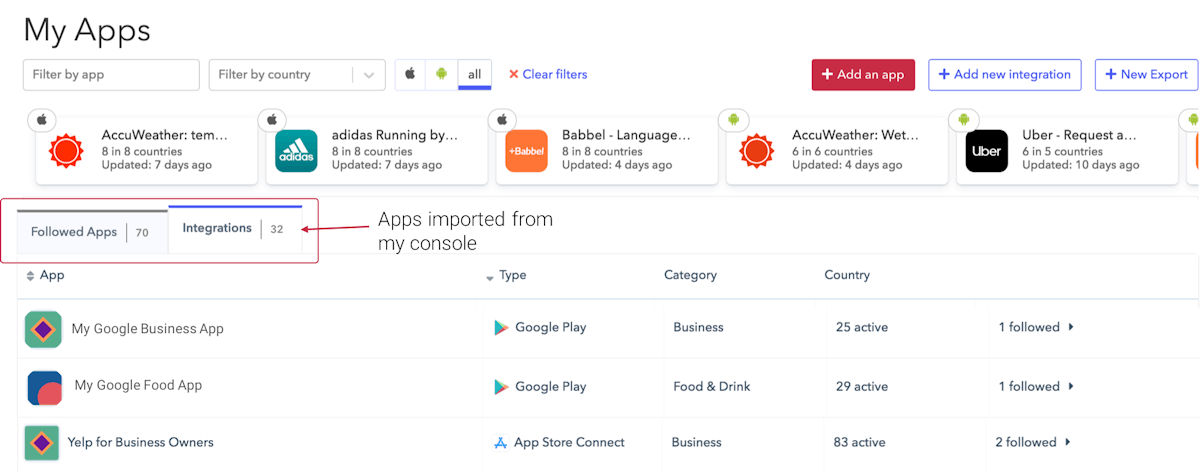
Access all of your apps by connecting your console to AppTweak.
For each imported app, AppTweak indicates the number of countries your app is available in and the number of countries in which you follow the app on AppTweak. If you open the details, you can choose the countries where you want to follow the app in just a click. Followed apps will be added to your Followed Apps dashboard. This allows you to select only the markets in which you are doing ASO for the selected app.
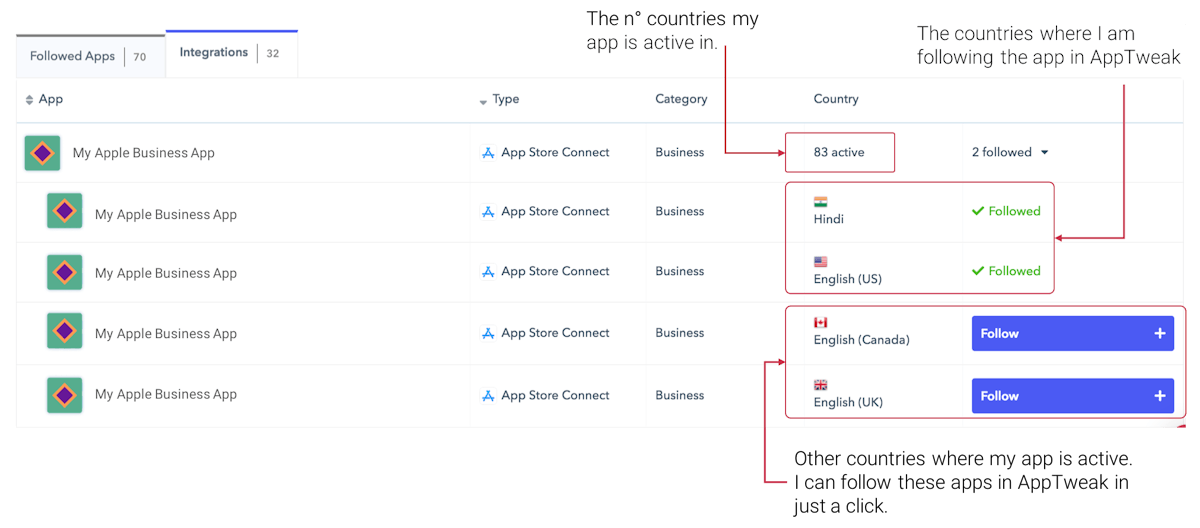
Select the apps and countries you want to follow on your AppTweak dashboard.
Expert Tip
Did you know that connecting your Google Play Console also allows us to fetch the apps you’ve added to your peer group and show them in competitor suggestions on AppTweak?
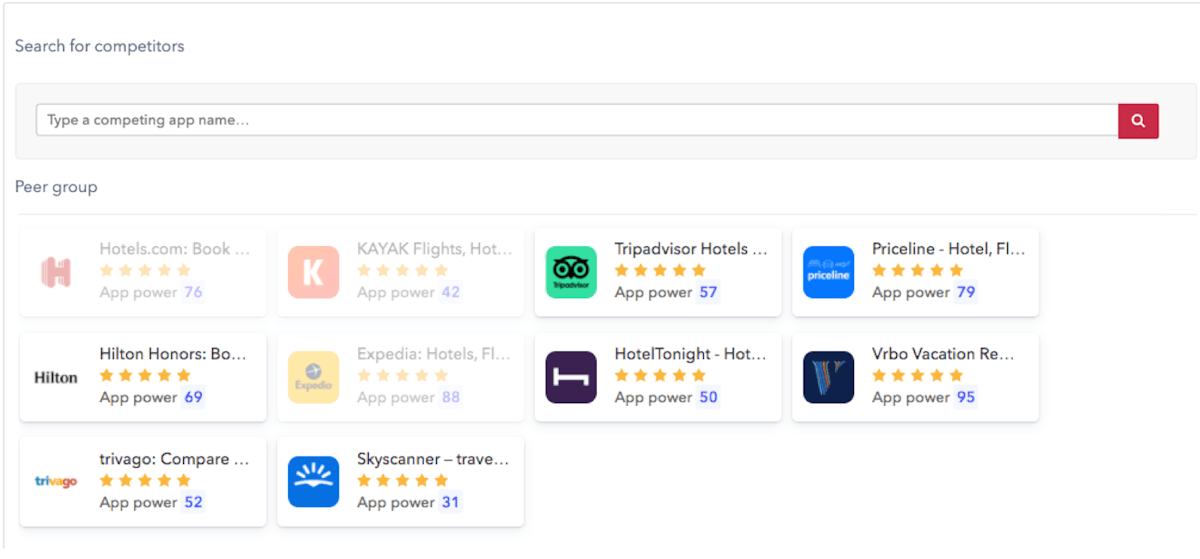
See the apps added to your Google Play Console peer group in AppTweak’s competitors’ suggestions.
Learn how to show your peer group directly on AppTweak
2. Access all of your data in one place
When you go about ASO, you obviously want to measure the results of your work and keep a careful eye on your app’s downloads, revenue, and conversion rate. By connecting your Apple and Google consoles, you can access this data directly on AppTweak. As a result, you can immediately check the impact of ASO events, such as metadata updates or being featured, on your app’s performance metrics within AppTweak.
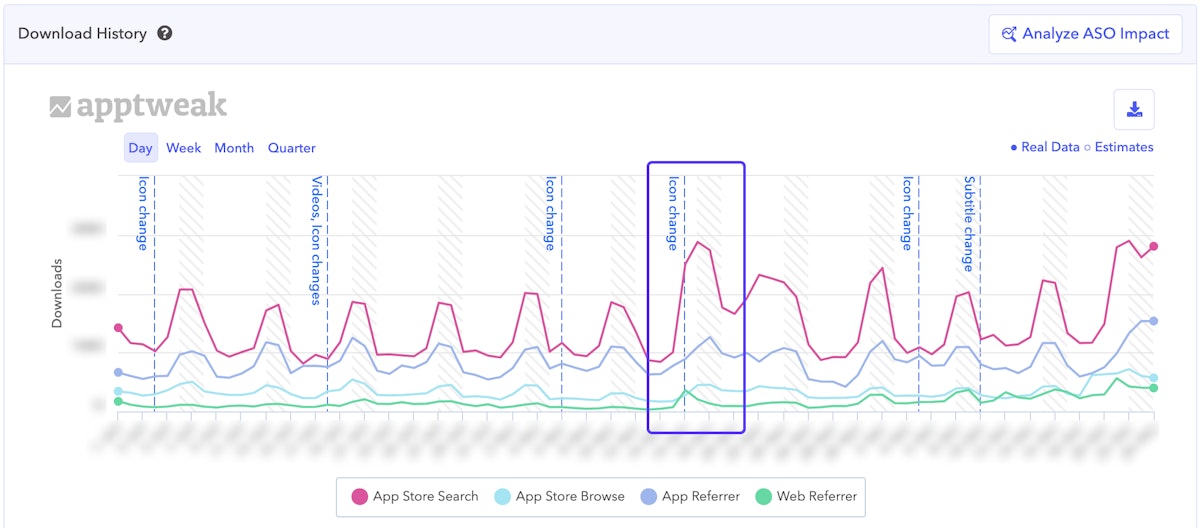
Measure the impact of a metadata change on your app’s performance metrics on AppTweak.
Learn more about our ASO Impact feature
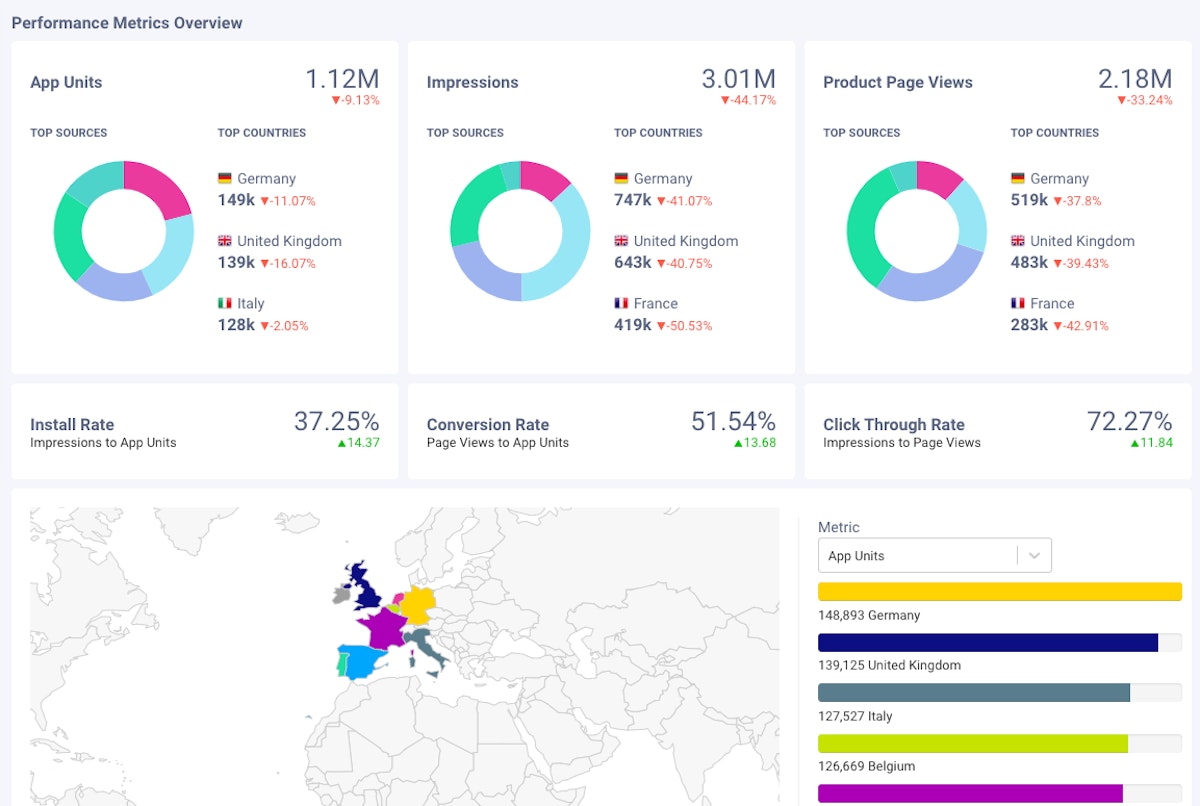
By connecting your App Store Connect console, you will be able to view your app’s App Units, Impressions, and Page Views directly in AppTweak’s Analytics section. In addition, you will access a full analysis of each of your app’s conversion rates:
- From Impressions to Installs
- From Impressions to Page Views
- From Page Views to Installs
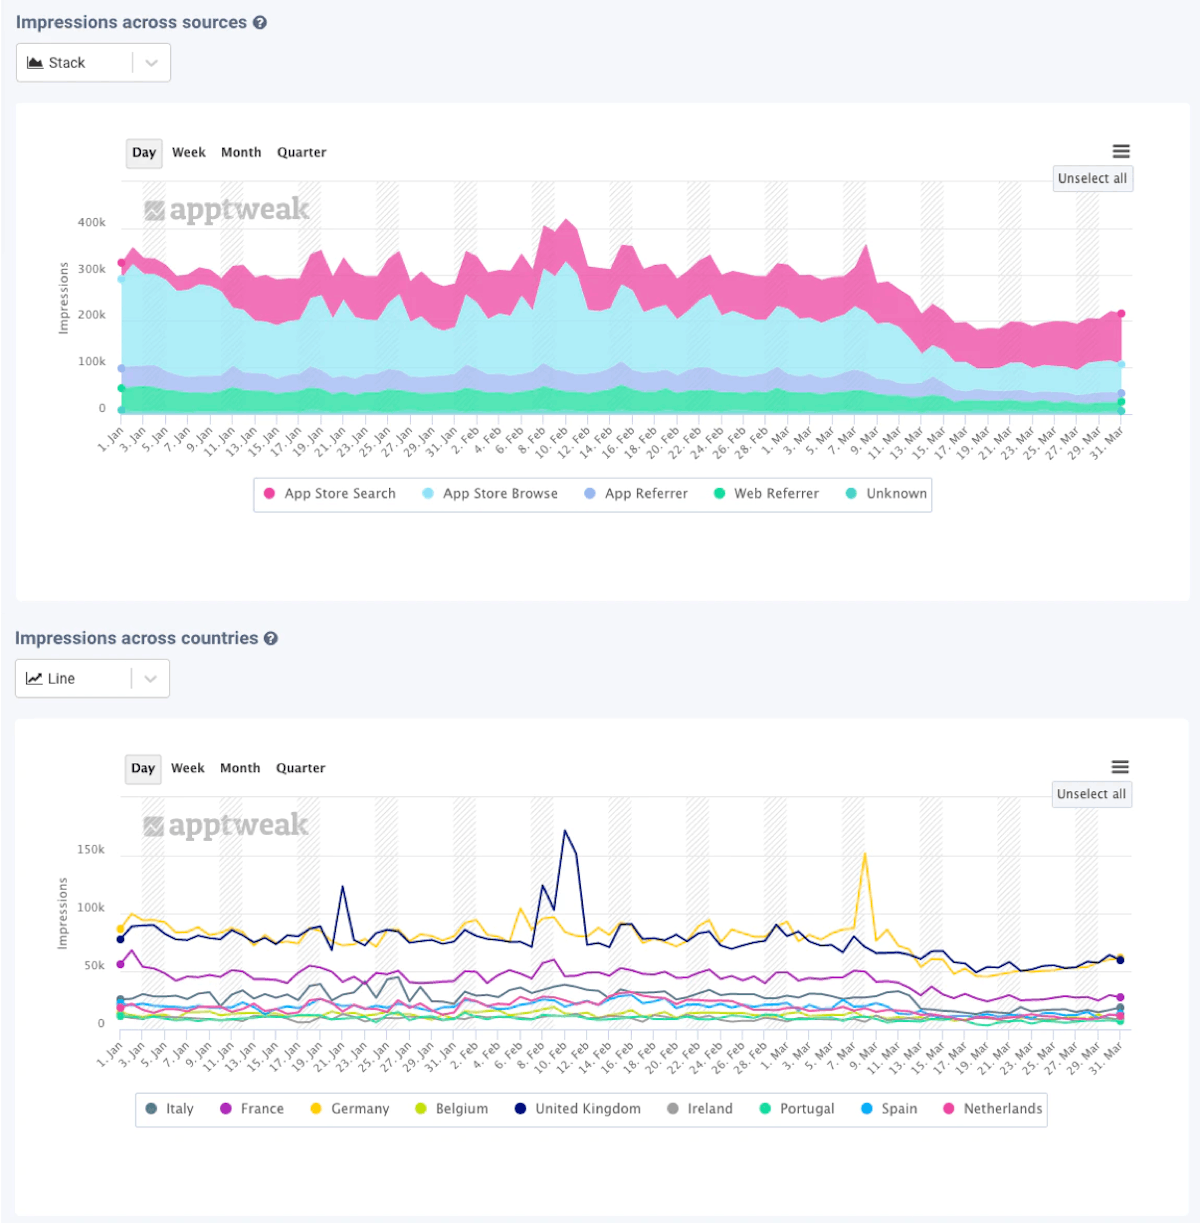
Each of these metrics can be broken down by source to help you identify the channel that works best for your app.
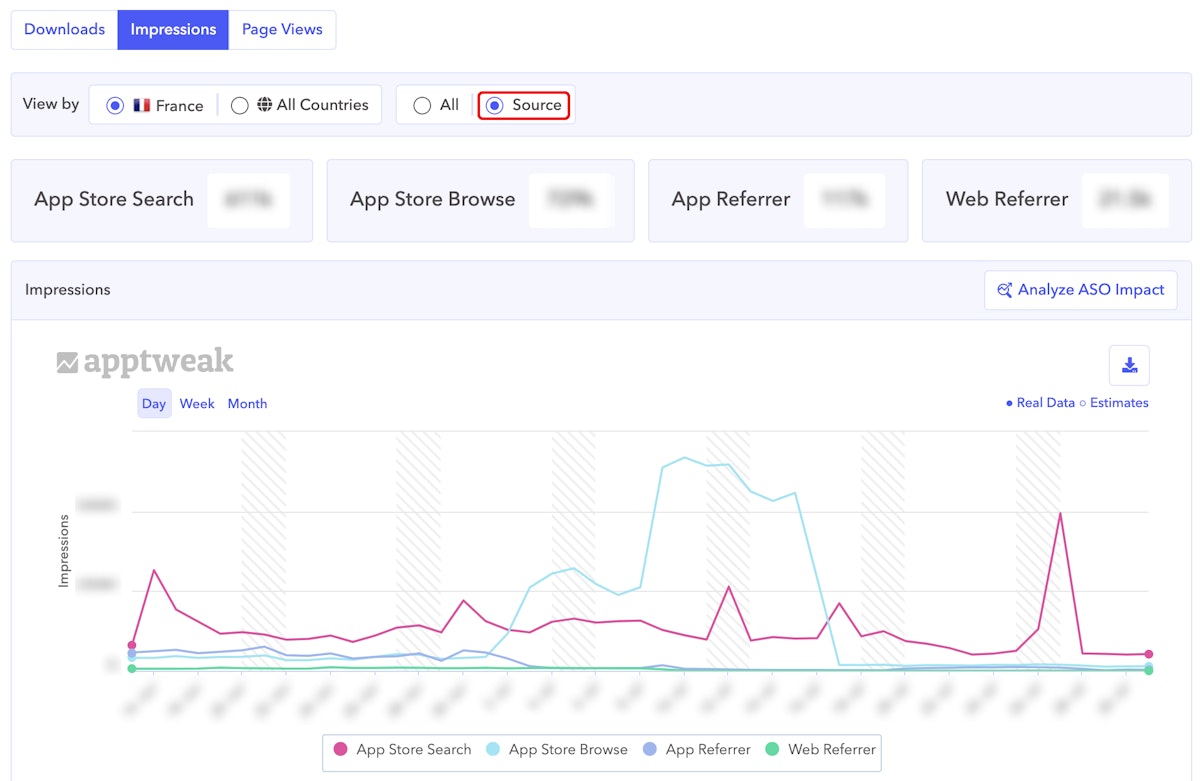
Check out your app’s metrics by source on AppTweak with the App Store Connect integration.
Discover the full range of our app analytics
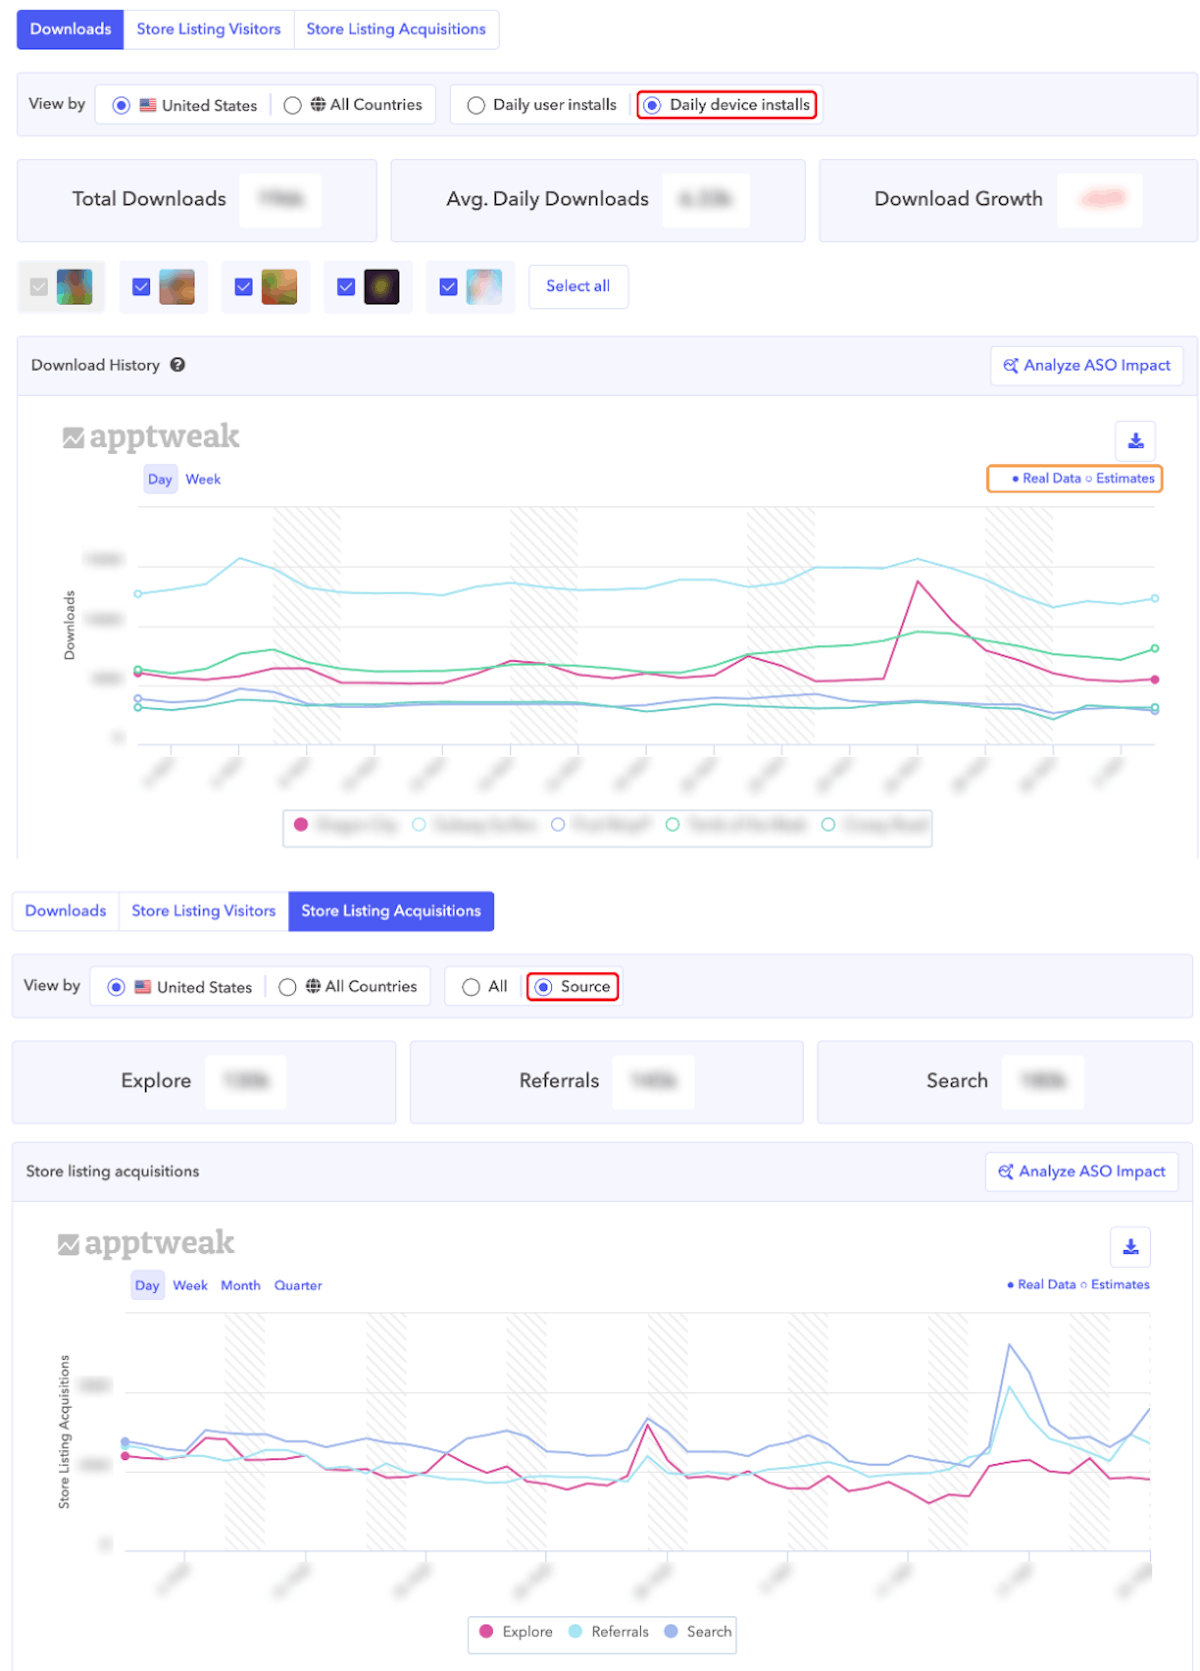
By connecting your Google Play Console, you’ll be able to access your app’s daily Installs, Store Listing Visitors, Store Listing Acquisitions, and Conversion Rate. For each metric, we also show a spread across the world map and a breakdown per channel.
Extra insights in AppTweak’s Analytics for apps with a Google Console integration.
Expert Tip
On AppTweak, you can also view all of your store performance metrics on a world map! This can help you immediately spot high- vs. low-performing markets.
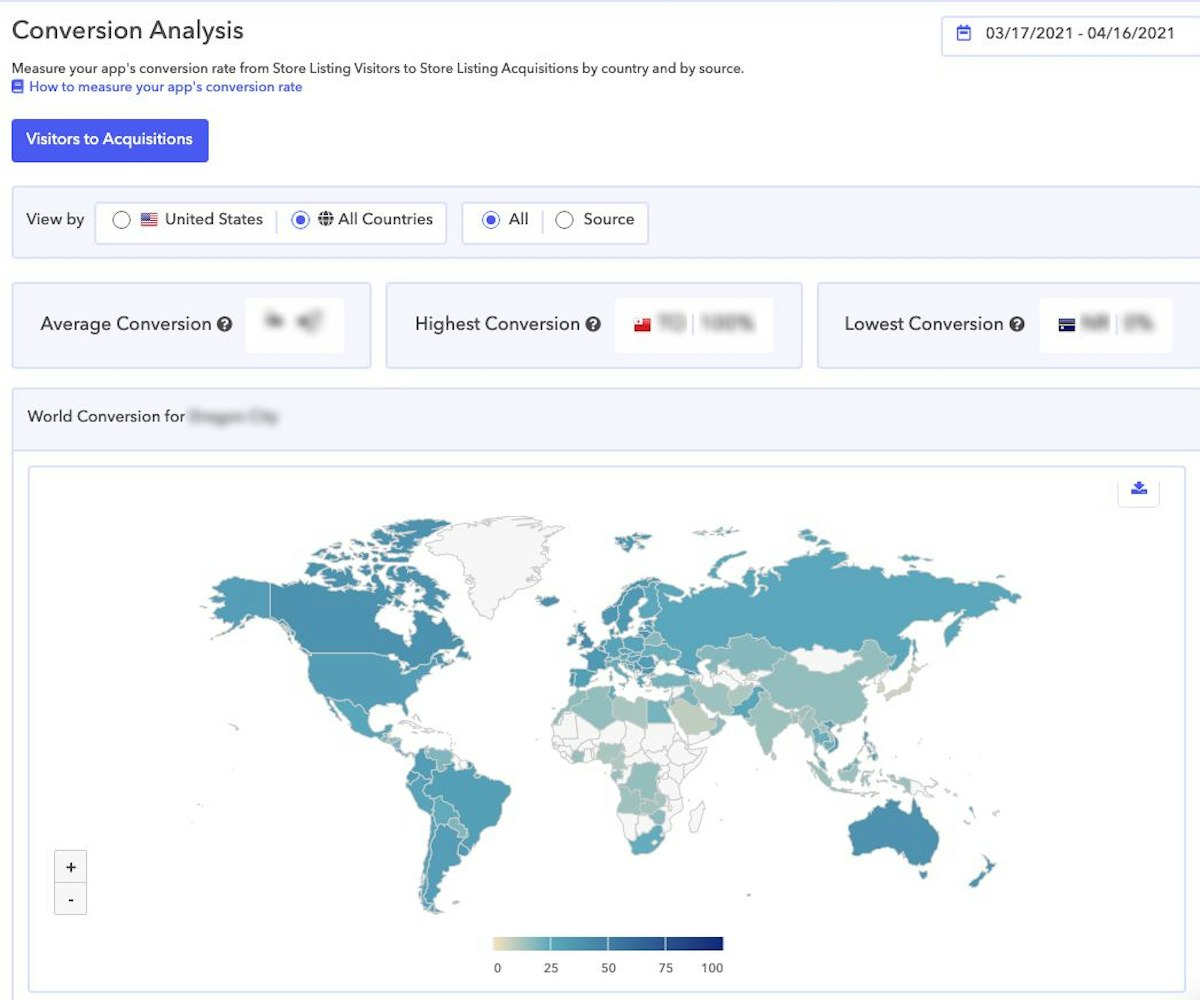
Compare your App Store Connect and Google Play Console metrics on a world map on AppTweak.
View and compare your app analytics across countries
Having your App Store Connect and/or Google Play Console data at hand becomes extremely handy to better understand the impact of your ASO work on your app’s metrics. For instance, you will be able to see if a surge in impressions was caused by a featuring, if a drop in installs came from a decrease in rankings for a high-volume keyword, or if an increase in your conversion rate is linked to your latest metadata updates, and so forth.
3. Get all of your install keywords directly from Google
Knowing the number of installs a keyword brings to your app is crucial in ASO. That’s why, by integrating your Google Play Console with AppTweak, you can access your top install keywords and their associated metrics directly on our ASO tool.
Once you’ve synced your account, you will find the list of your top install keywords in the Analytics section, under the tab “Google Keywords.” In this section, we list your app’s top install-driving keywords along with the number of Store Listing Visitors, Store Listing Acquisitions, and the Conversion Rate.
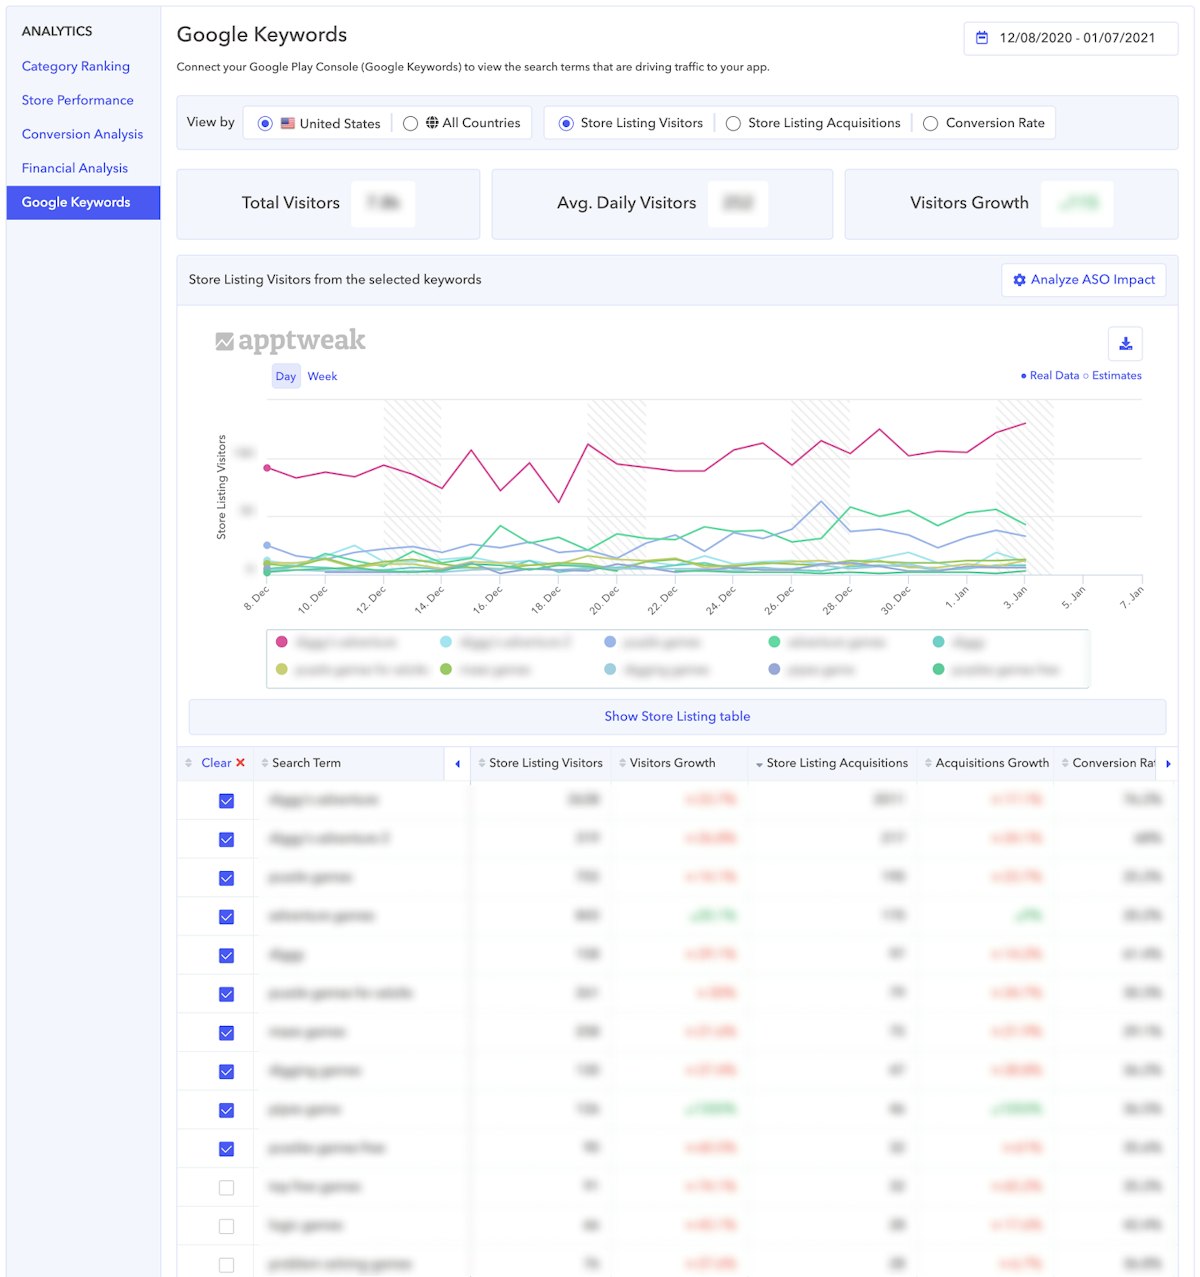
Connect your Google Console and access your app’s top install keywords and associated metrics.
To make it easier to build your keyword lists, you can also access your top install keywords directly in the Keyword Suggestion feature of our Keyword Tool. Here, AppTweak shows your top install keywords and the number of downloads they bring to your app. All you have to do is click on the keywords you want to add to your list to get extra metrics.
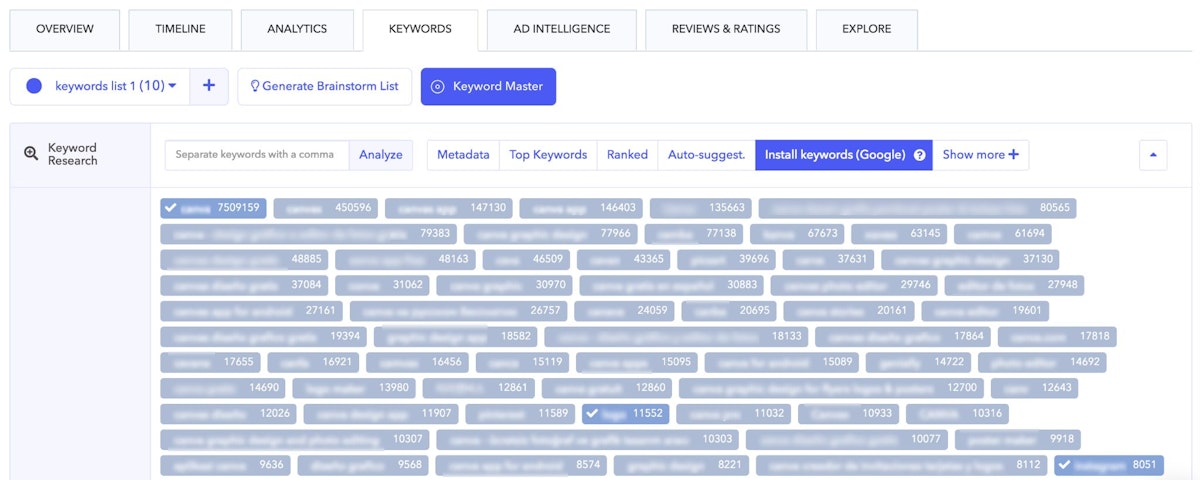
Access your top install keywords directly on AppTweak’s Keyword Suggestion tool.
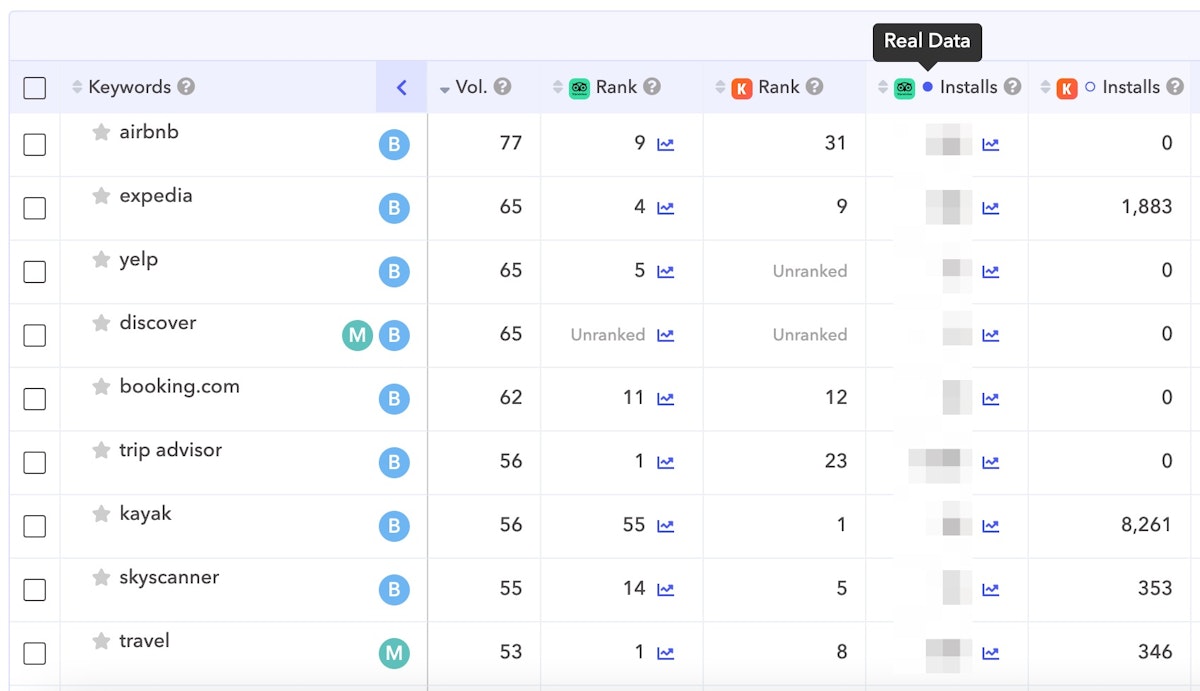
Finally, if you connect your console with AppTweak, the installs per keyword displayed in all relevant tables and charts will be those directly provided by Google. In other words, we’ll replace AppTweak’s estimates with the data coming from your integration. This way, you’ll be able to evaluate your app’s performance with great accuracy!
Expert Tip
Don’t forget that the Google Play Console includes both paid and organic downloads for each keyword (the data you see when you’ve added your integration). On the other hand, AppTweak’s estimates only consider organic downloads.
Unlock more features in Market Intelligence
4. Benchmark your app against the market
In our Market Intelligence add-on, connecting your apps to AppTweak will allow you to benchmark them against the market of your choice. Select a set of countries and categories and see where your app stands. In just a couple of clicks, you’ll be able to see where your app ranks across the top charts of the selected countries, what your app’s market share is in terms of downloads and revenue, and how your app’s seasonality compares with the general market trends.
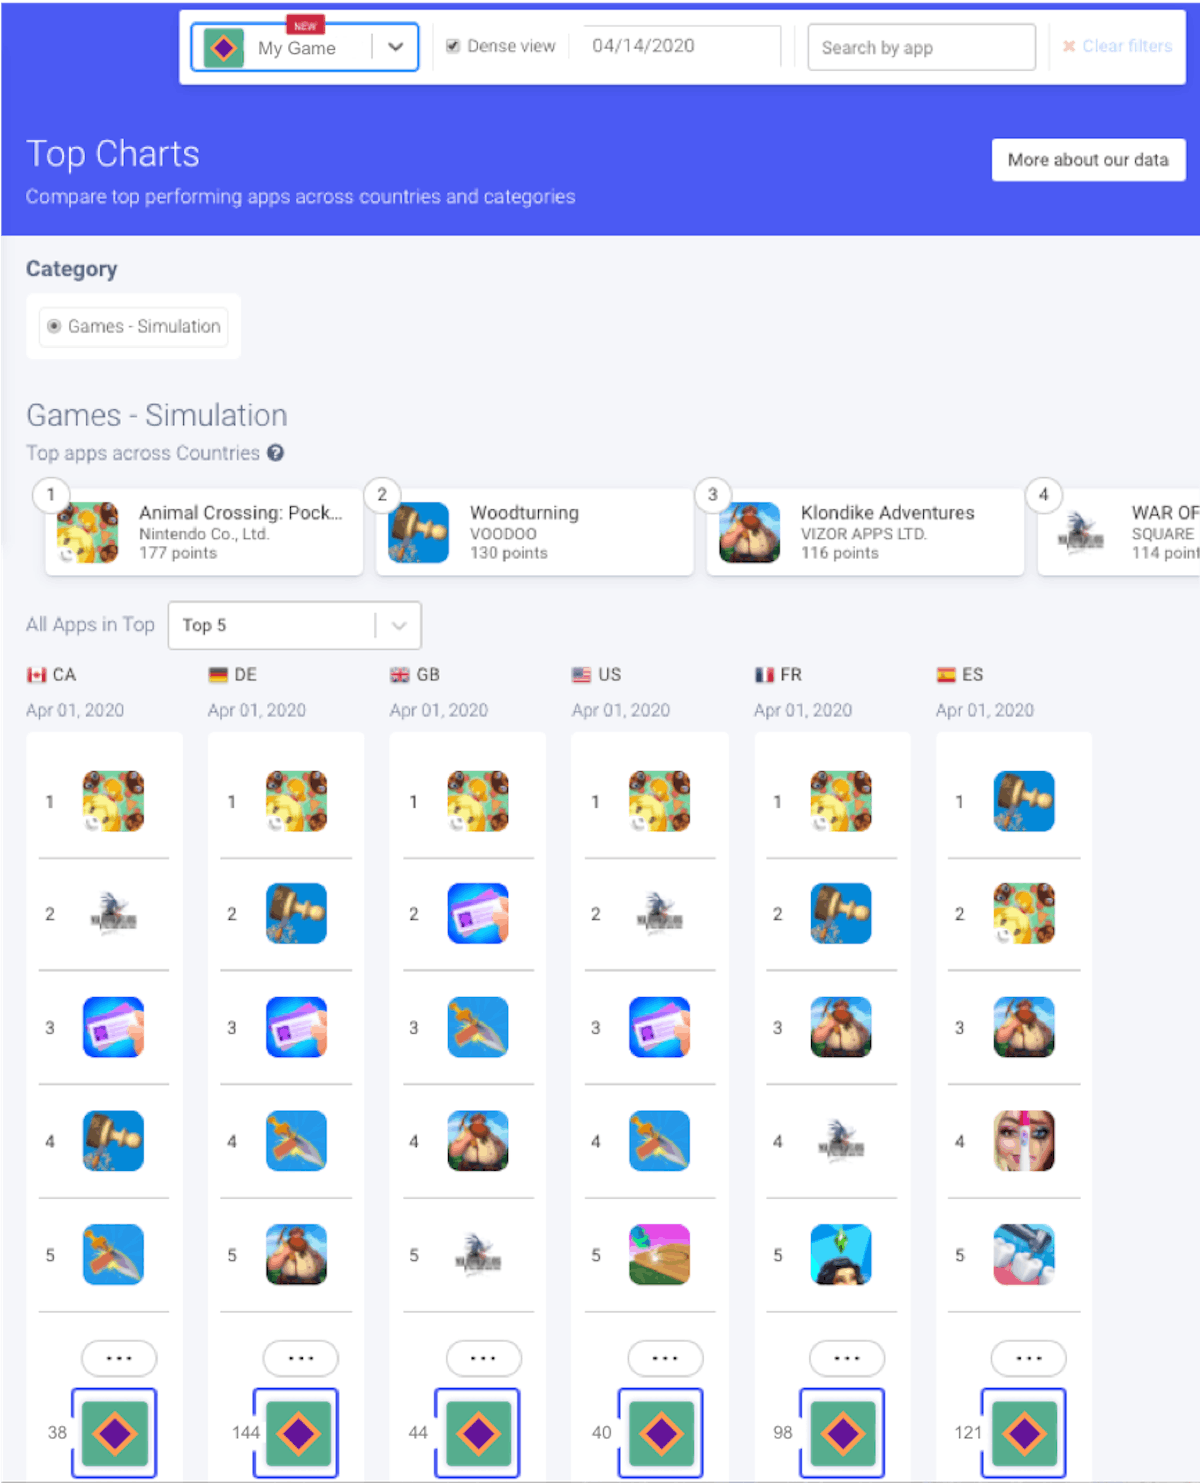
Benchmark your app’s position in top charts across countries.
Check out all of our benchmarking features in Market Intelligence
Unlock features in App Intelligence
5. Analyze your apps’ metrics across countries
With our App Intelligence add-on, you can analyze a set of apps across different countries. Here again, connecting your console to AppTweak unveils a huge amount of extra insights.
Summary of your app’s performance across countries.
You will be able to very easily carry out analyses either across the selected countries or by comparing your app’s performance from one country to another.
Check out the insights you can discover by connecting your console with App Intelligence
 Analyze your app’s metrics across countries and compare them from one country to another.
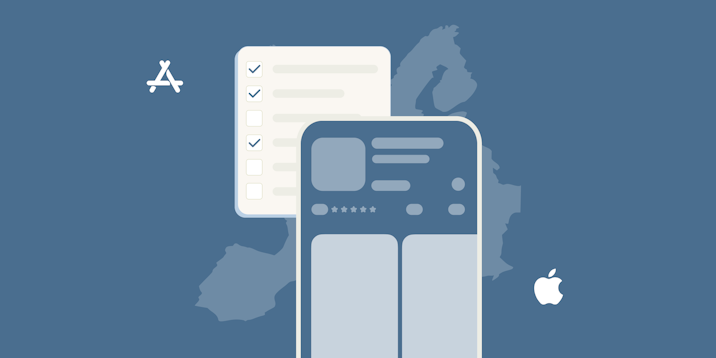
How to connect your Apple & Google consoles to AppTweak
If you wish to connect your data to AppTweak, we currently have 3 possible integrations, each with its specific process:
To add a new integration, simply click on “Connect my apps” in your dashboard.
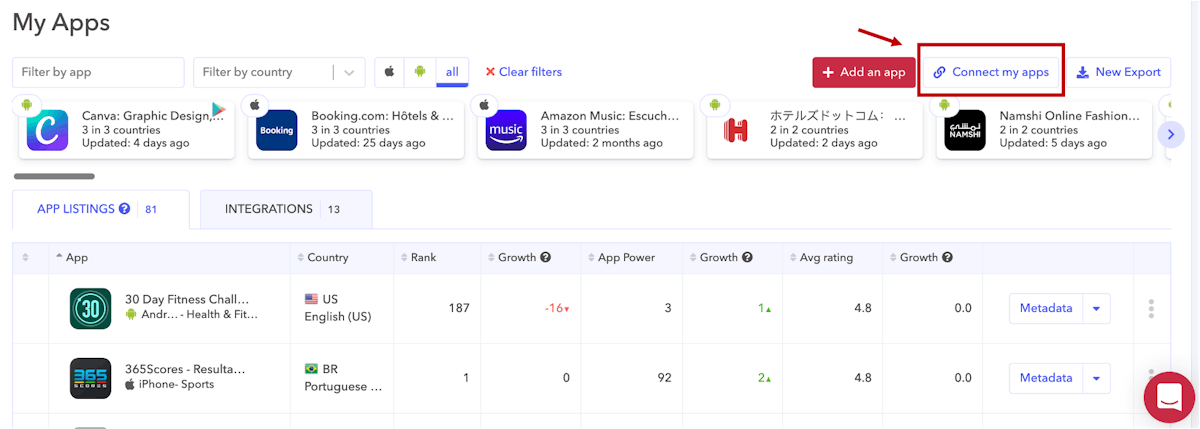
Connect your apps to AppTweak.
In the My Account > Integrations section, you can find and manage all of the integrations you’ve made on your AppTweak Account.
Expert Tip: We have an extra integration available! Access data from your Search Ads Campaigns directly on AppTweak thanks to our Search Ads Integration. Check out this article to discover this extra feature!
We hope the examples above have given you a better idea of the value of connecting your console to AppTweak! Please keep in mind that none of these integrations are mandatory, and you can totally use AppTweak at its (nearly) full potential without them. That said, connecting your console will help you unlock extra insights specific to your own app, as detailed above.
Related posts
 App Market Insights
April 22, 2024
Discover these 10 hidden gems on AppTweak to help boost your ASO.
 Advanced ASOApp Market Insights
February 15, 2024
Understand how mobile marketers can maximize their impact by leveraging the app stores as a true marketing channel.
 App Market Insights
January 31, 2024
Here are our key takeaways on how Apple plans to comply with the DMA’s new rules.
 App Market InsightsSearch Ads
January 29, 2024
Discover how mobile gaming apps are leveraging custom product pages on the App Store.
 Advanced ASOApp Market InsightsArtificial Intelligence (AI)
January 11, 2024
Discover the interesting trends already at play in ASO that are worth keeping an eye on in 2024.
 App Market InsightsGuest Insights
January 8, 2024
Keep these expert tips in mind to create an effective preview video for your app/game.
 Taya Franchville
 Sukanya Sur
 Simon Thillay
 Marine Nozerand