
Reporting Studio, one of AppTweak’s most powerful new products, allows you to build custom app performance reports that combine all your growth metrics across sources.
We are extremely excited to announce that AppsFlyer data is now available in Reporting Studio! With this new integration, now unlock impactful graphs and insights to help measure your app’s growth across channels.
In a few simple steps, connect your AppsFlyer account to AppTweak to monitor more app growth metrics directly in Reporting Studio: including Installs, Revenues, Sessions, Event Count, and User Count.
Want to learn more about AppTweak’s new AppsFlyer integration? Read this blog to find 4 ways you can leverage AppsFlyer data in Reporting Studio.
AppsFlyer is one of the biggest Mobile Measurement Partners (MMP) in the mobile app market. One of AppsFlyer’s primary functionalities is mobile attribution. Connecting AppsFlyer to different Ad Networks allows you to attribute each install you get to its proper source.
Besides this, AppsFlyer also acts as a marketing analytics platform, allowing users to track post-install user actions such as sign-ups, logins, in-app purchases, or other in-app events. Combining both attribution and marketing analytics, AppsFlyer helps quantify the value of your acquisition channels to optimize ROI.
On the other hand, AppsFlyer does not provide deep insights into your ASO analytics, despite paid acquisition impacting ASO performance. With our new AppsFlyer integration in Reporting Studio, you’ll be able to plot your ASO performance next to paid acquisition to more accurately measure impact.
6 ways to measure app performance with Reporting Studio
1. Compare organic vs. non-organic installs in one place
First, AppsFlyer data in Reporting Studio can help you better analyze your organic and non-organic downloads. To plot both in Reporting Studio, just select the “Source” dimension and the “organic” and/or “non-organic” option.
Expert Tip
Organic downloads are important because they often bring in high-value users. These are users who find your app on their own and choose to install it without any push. While organic installs are not totally free, you don’t have to pay for each download like with paid ads. As such, improving your organic installs often comes with higher engagement and lower costs, and can save you a lot of money.
In the above example, we monitor this app’s total, organic, and non-organic downloads on a single graph. While we see that total downloads have decreased over the time period, organic downloads have slightly increased. This suggests that a share of paid acquisition has been replaced by free organic downloads.
When non-organic downloads decrease, organic downloads tend to increase, which may indicate the presence of cannibalization. Traffic cannibalization happens when a user searches with a keyword and downloads an app through its Apple Search Ads (ASA) placement, although they would have found and downloaded the same app through its organic search result.
Learn how to measure cannibalization in Apple Search Ads
Combine your data sources to get the bigger picture of your app’s growth. Once you have determined whether or not your ads are experiencing cannibalization, be sure to then follow our do’s and don’ts for Apple Search Ads to optimize your bidding strategy.
2. Monitor App Store Connect vs. AppsFlyer MMP data
AppsFlyer calculates downloads in a different way than App Store Connect. In Reporting Studio, you’re now able to plot all your different sources on the same graph and avoid back-and-forth between channels.

In the above graph, we’ve plotted this app’s total downloads from App Store Connect and from AppsFlyer. We can see that AppsFlyer consistently registers fewer downloads than App Store Connect. However, the spread in terms of installs varies a lot between different dates. For instance, on August 1st we calculate a difference of 300 installs (40%) between App Store Connect and AppsFlyer. Two days later, we observe a much lower difference between the two sources (80 installs or 10%).
Why am I seeing different data between sources?
When comparing app data from different sources, you might encounter similar discrepancies for various reasons. Try to identify the reason behind each discrepancy to close the gap. Here are a few potential explanations:
- App Store Analytics vs. MMP platforms: The App Store and Google Play consoles register an install as soon as an app is downloaded. On the other hand, attribution platforms like AppsFlyer register installs when a downloaded app is first launched. Attribution platforms will therefore underestimate installs compared to the app store consoles (App Store Connect / Google Play Console).
- Accounts vs. devices: The app store consoles count installs based on unique internal account IDs, while AppsFlyer uses unique device IDs. If a user installed one app on two devices, this would be counted as one install by the app store consoles and as two installs by AppsFlyer. In this case, AppsFlyer may overestimate installs.
- Timezone: When comparing install rates, don’t forget to consider the timezone in which these installs were registered. Platforms often allow you to adapt timezones, so make sure to set them to the same one – especially when comparing installs day-by-day.
Using another MMP? You can also integrate Adjust with AppTweak!
3. Attribute revenue per Apple Search Ads keyword
When you’re spending money on Apple Search Ads to acquire new users, your end goal is getting a positive return on investment (ROI).
However, while Apple Search Ads provides many analytics about your cost per acquisition, it doesn’t provide data about post-install events. Here’s where an attribution tool like AppsFlyer comes in handy, allowing you to monitor a variety of post-install user actions like paid subscriptions or in-app purchases.
With Reporting Studio, you can now plot both revenue and spend per keyword from your two main data sources: Apple Search Ads and AppsFlyer.
Expert Tip
Divide revenue by ad spend to determine your Return on Ad Spend (ROAS). Of course, you’ll always want to ensure your revenues exceed your ad spend by a reasonable amount to account for costs (e.g., your 30% App Store fee and 20% in additional taxes, customer support, or production costs).
In the above example, we’re able to compare AppsFlyer’s revenue data for the keyword “buy bitcoin” and the ad spend in Apple Search Ads for the same keyword.
It’s important to note that your revenue per keyword might not be driven by users who installed the app the same day. Since AppTweak shows Activity Data from AppsFlyer (more on this here), revenue is displayed in chronological order. If you want to see revenue grouped by user acquisition date to compare it with the amount spent the same day, you’ll need to examine the lifetime value (LTV).
4. Measure in-app events (in-app purchases, logins, etc.)
Besides revenue, you may also want to track other events at different stages of the user journey funnel. Suppose you’re a gaming app with in-app purchases. Users won’t probably purchase items the first time they install your game. Therefore, you might want to track in-app events that happen after the app is installed and before the purchase to measure conversion rates at each step.
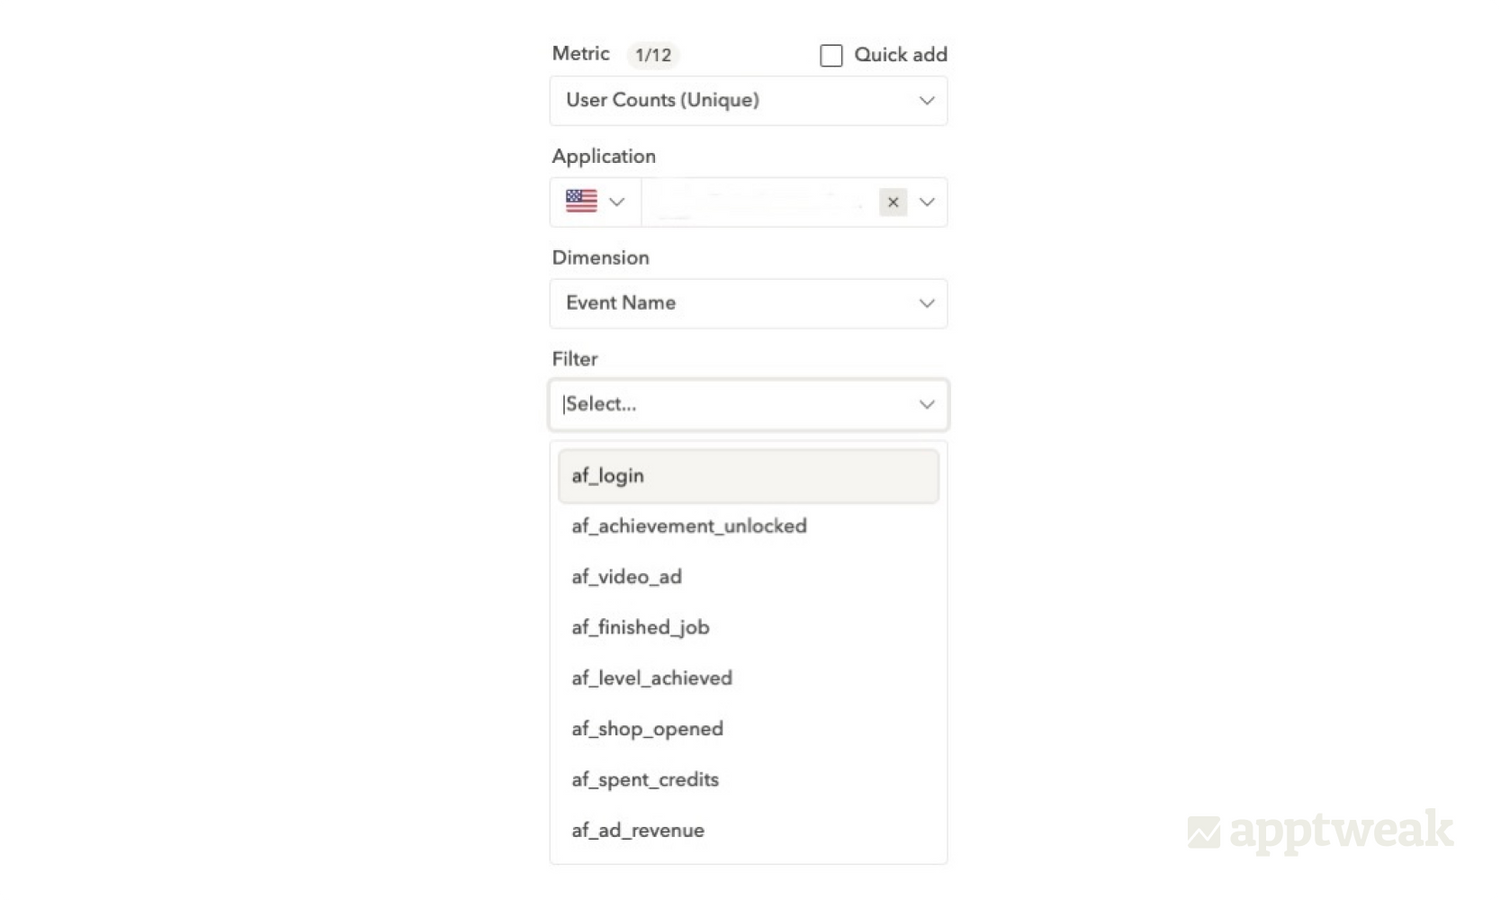
You can easily measure a variety of in-app events with our AppsFlyer integration in Reporting Studio. For example, easily track user count for custom events, such as login, level achieved, or any configured AppsFlyer event inside Reporting Studio.
Conclusion
AppsFlyer is a market leader for mobile attribution and marketing analytics. Your AppsFlyer data can provide great insights about your acquisition funnel; however, you might be missing the big picture by not combining data sources or analyzing the impact of paid acquisition on ASO.
With AppTweak’s latest integration in Reporting Studio, now monitor all your data sources in one single place. Want to try it out? Get in touch with our team today.
Reporting Studio is automatically available with an AppTweak Enterprise plan.


More articles in Product Updates

 Georgia Shepherd

