
Most app developers and marketers refer to conversion rate (CVR) as the proportion of store visitors that download your app after viewing its page – as a key ASO metric to monitor. With AppTweak’s Conversion Rate Benchmark feature, you can easily find out the average conversion rates of apps in any category on the App Store and/or on Google Play.
For the App Store, you should also consider your install rate, that is the proportion of store visitors who download your app after seeing it elsewhere in the store. Unlike on Google Play, visitors on the App Store can download apps directly from search or browse results. As a result, the install rate demonstrates how well your app stands out in search and browse results.
In 2025, AppTweak found that the average conversion rate across categories in the US was 8.56% on the App Store and 16.15% on Google Play. Explore app store benchmarks for top apps & games.
Conversion rates and install rates vary widely between the different categories. In this blog, we provide the conversion rates and install rates (iOS only) of each major app category on the US App Store and Google Play Store. These insights are valuable in helping you choose the most relevant category that has the maximum potential to drive downloads to your app.
Optimize your app product page to boost your conversion rate
Conversion rate metrics on the App Store and Google Play
There are two metrics you should consider when analyzing your app store conversion rate:
- Conversion Rate (App Unit/Page Views): The percentage of users who download your app after viewing its page. This metric is used across the ASO community when referring to app store conversion rates. It can give you an idea of how well your app page convinces users to download your app.
- Install Rate (App Unit/Impressions): The percentage of users who download your app directly from the app store search or browse results, without clicking through to your app page. The install rate tells you how well your app stands out in the app store search/browse results.
Note: The App Unit is the number of first-time app downloads made on the App Store (including both paid and free apps). Furthermore, on the App Store, it is possible to have a conversion rate greater than 100%. In this case, the number of first-time installs would exceed the number of app page views. This would indicate that most people download your app directly from the search or browse results, without visiting your app page first.
Discover how to optimize your app’s conversion rate and drive downloads!
How to find app store conversion rate benchmarks on AppTweak
Thanks to our Conversion Rate Benchmarks feature, we can provide you with the average conversion rates per store, category, country, and channel.
On AppTweak, you can see average app conversion rates for each store, category, country, and channel. The first column shows the Click-Through Rate (page views/impressions); the second column shows the Conversion Rate (app units/page views); and the third column shows the Install Rate (app units/impressions).
Learn more about AppTweak’s conversion rate benchmark feature.
Average app conversion rate on the App Store
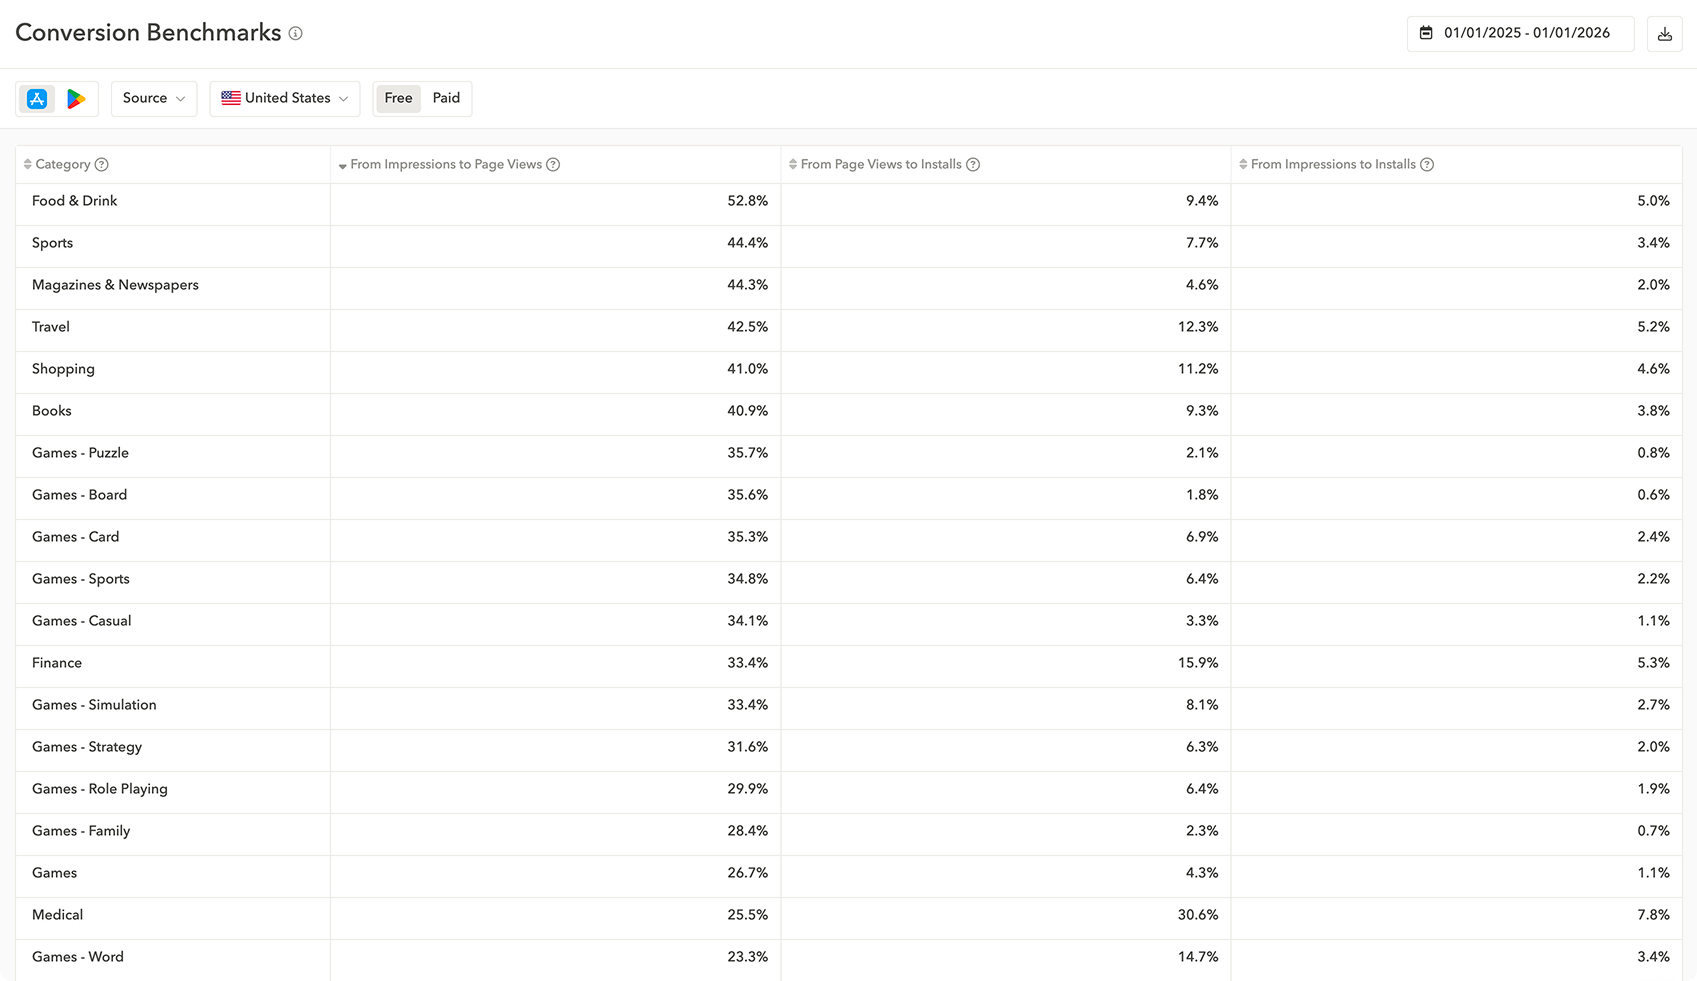
In 2025, the average conversion rate in the US App Store was 8.56%. However, this figure fluctuated greatly between categories and should therefore be handled with caution. For instance, the highest average conversion rate was observed in the Food & Drink category, with an average CVR of 52.8%. On the other hand, we saw the lowest average conversion rate in the Games – Trivia category, with an average CVR of 5.2%.
Average app conversion rate on Google Play
In 2025, the average conversion rate on US Google Play was 16.15% and thus higher than the average CVR on the App Store (25%). The Auto & Vehicles category had the highest average CVR of 62.3%, while the Games-Strategy category had the lowest average CVR of only 6.6% on Google Play.
Average app install rate on the App Store
In 2025, the average install rate on the US App Store was 3.8%. On average, 3.8% of users downloaded apps after seeing them in App Store search or browse results.
The install rate can vary between categories. From search or browse results, apps in the Medical category converted store visitors at the highest rate of 7.8%, while apps in the Games – Board category had the lowest install rate of 0.6%.
TLDR
Let’s recap the average conversion rates and install rates on the App Store and Google Play in 2025:
- The average conversion rate (CVR) across all categories on the US App Store was 8.56%.
- The average CVR across all categories on the US Google Play was 16.15%.
- The average install rate across all categories on the US App Store was 3.8%.
- Conversion rates and install rates varied greatly between categories.
- On the App Store, the Food & Drink category had the highest CVR (52.8%), and the Games – Trivia category had the lowest (5.2%).
- On Google Play, the Auto & Vehicles category had the highest CVR (62.3%), and the Games – Strategy category had the lowest (6.6%).
- On the App Store, the Navigation category had the highest install rate (7.8%) and the Games – Board category had the lowest (0.6%).
With AppTweak’s Conversion Rate Benchmarks, you can compare your conversion rates, install rates, and click-through rates with other apps in your industry! Sign up for a free trial to discover how AppTweak can help you monitor vital ASO metrics.


 Sukanya Sur
More articles in App Market Insights

 Pierre-Antoine Roy

 Micah Motta
