
Get Advanced Insights About Your App’s Featurings
Good news! We have completely revamped our Featurings section! After conducting multiple feedback sessions, client interviews, design iterations, and developments, we are now happy to present our new and improved Browse/Explore tool. Our team loves the results and we hope you will too!
Receive an overview of your app’s featurings
Competition summary & downloads per featured story
Understanding how often the app stores feature you or your competitors and determining the impact on downloads or views (impressions) can be tricky.
That’s why in the Overview section of our Browse/Explore tab, you’ll be able to access this information with just a click!
AppTweak counts the number of featurings each app gained over the selected date range, both in the Today tab and the Apps or Games tabs of the App Store. The chart on the right also allows you to monitor the evolution of your featurings over time.
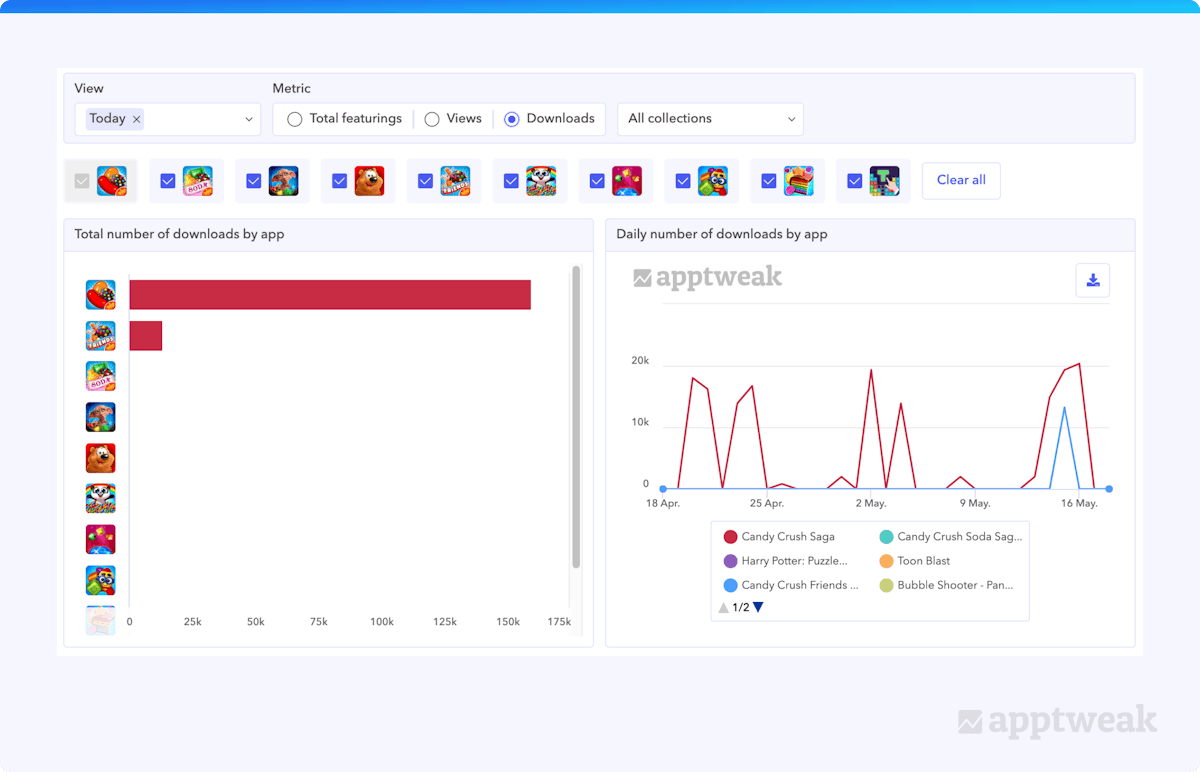
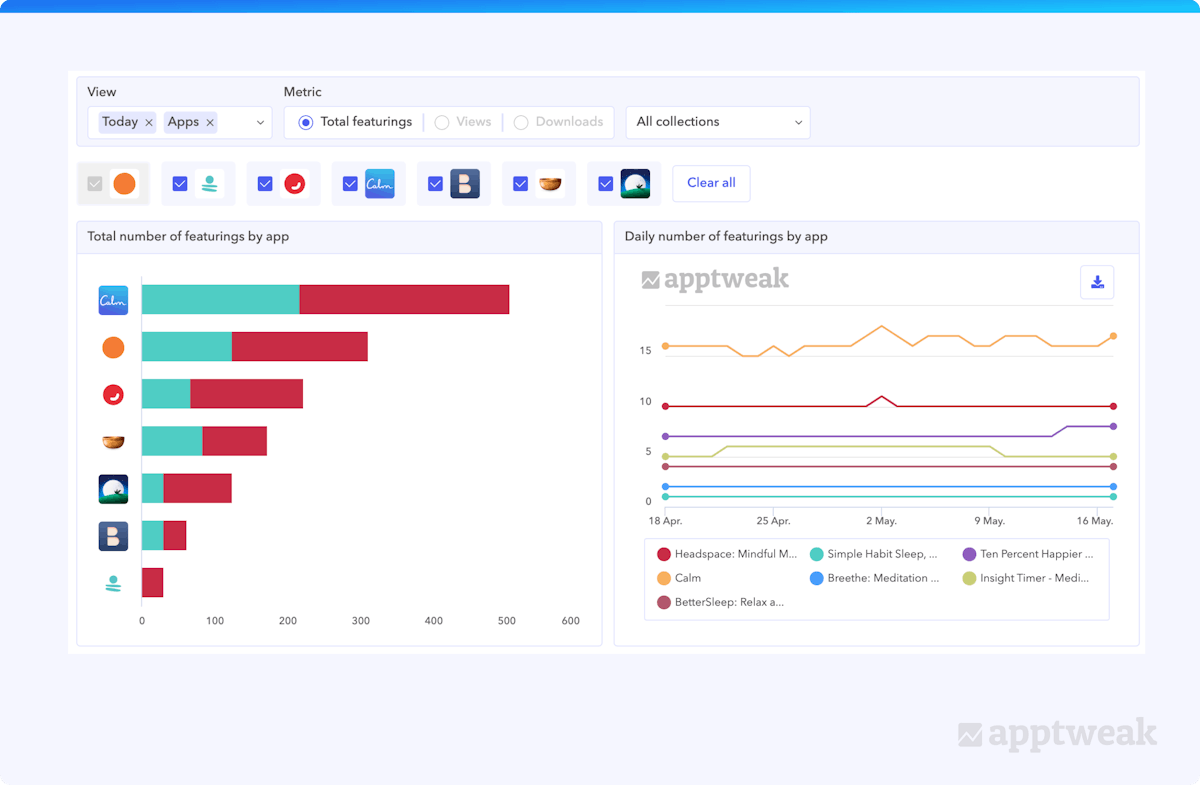 Here comes the important question: how do featurings on the App Store or Google Play impact your installs? AppTweak covers this for you! We’ve built an algorithm that estimates the installs gained per featuring for all Stories that appear in the Today tab. You’ll be able to monitor how these numbers change over time and which competitors receive installs from Browse traffic.
Update: As of February 2023, apps on Google Play must achieve at least a 3.0-star rating to feature in the top charts.
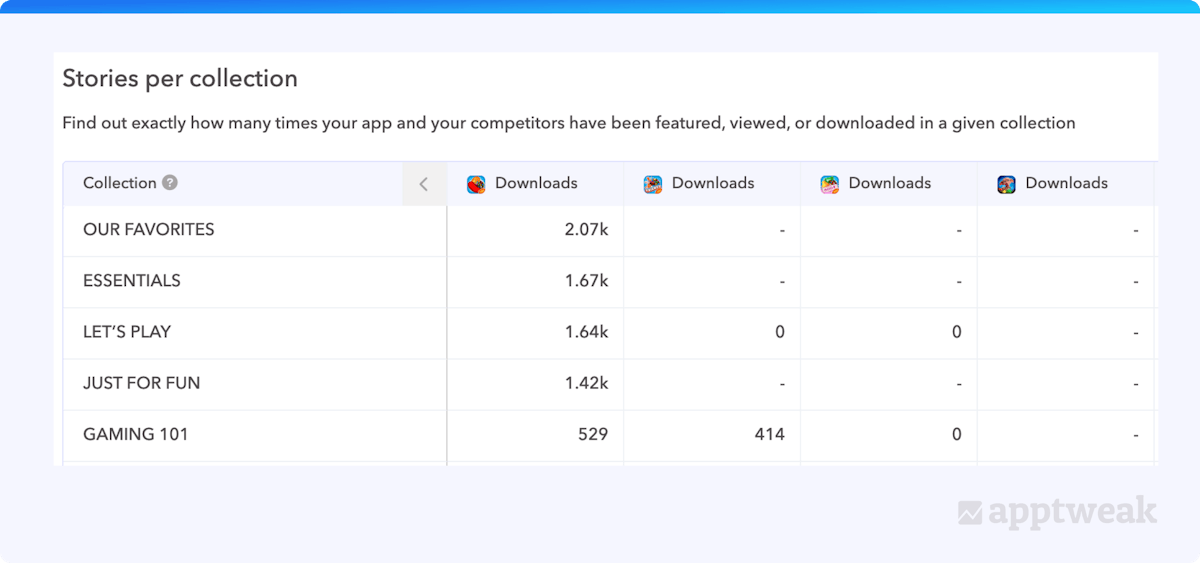
 Finally, we provide 2 more tables on this page. In one, you’ll discover a breakdown per editorial collection that gives you a more precise view of where Stories, views, or downloads came from. For example, we see below that Candy Crush Saga received most of its Browse downloads from the “Our Favorites” collection in the US, but also regularly appeared in 3 other collections.
The “Overview” page highlighted above predominantly focuses on analytics and charts. Curious to understand more about the specific Stories your app was featured in? Head over to the “All Stories” page!
Explore insights about each “Story” featuring your app
In this section, you’ll find all the featurings in which your app or your competitors appeared over the selected date range. For each one, find out where you were featured, for how long, the keywords your app was featured on, and how many downloads you received.
These featurings appear in 3 categories:
- Unique featurings: Stories in which your app appeared but your competitors didn’t
- Shared featurings: Stories in which both you and your competitors appeared
- Missed opportunities: Stories in which your competitors appeared but you didn’t
Once you’ve selected one of these primary filters, you can filter the Stories by source – Today, Search, or Apps/Games – using the bar beneath. Stories that appear in keyword search results fall under the “Search” filter, but sometimes also under “Today.”
You might want to view “Stories” in the Today tab by downloads, Search Stories by keyword rankings, or Games Stories by recency. All these combinations are possible with AppTweak.
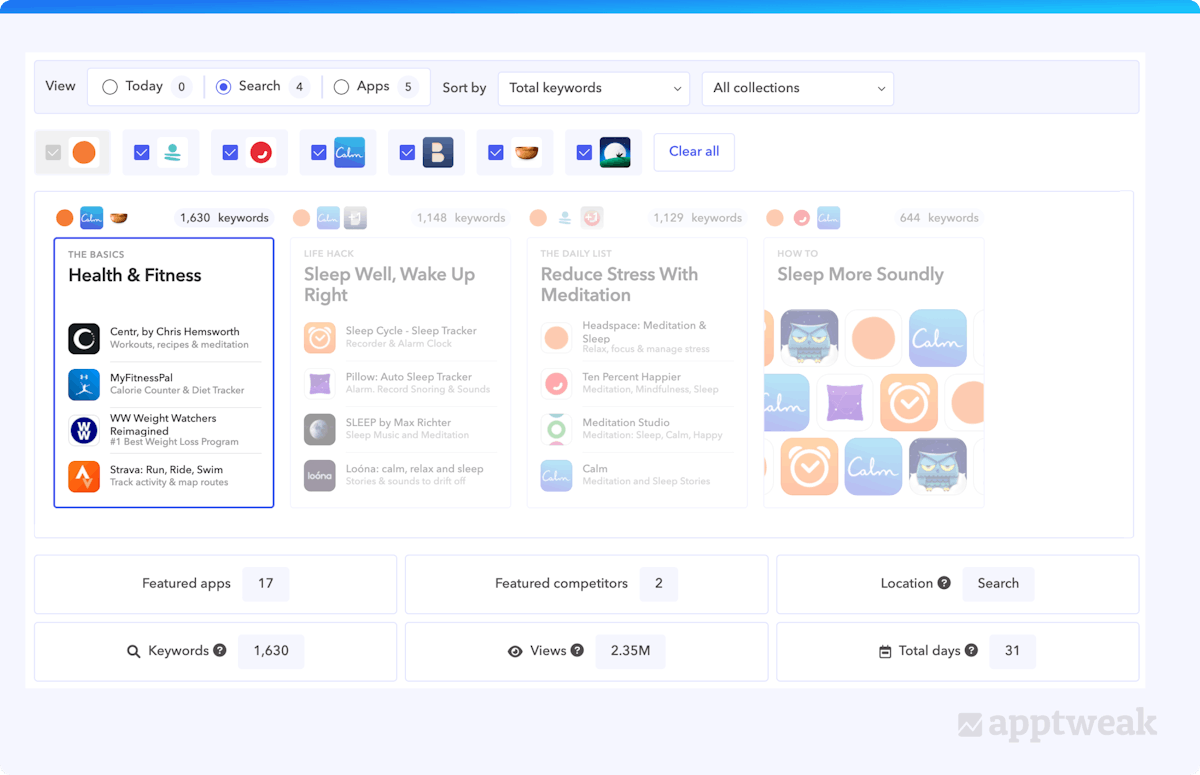
When you click on a “Story,” the metrics displayed below it will update accordingly. For example, selecting “The Basics” collection in Health & Fitness reveals 17 featured apps, including 2 Headspace competitors. You also notice this “Story” appears in keyword search results, ranking for 1,630 keywords. With the Story running for 31 days, AppTweak estimates that users viewed this feature 2.35 million times.
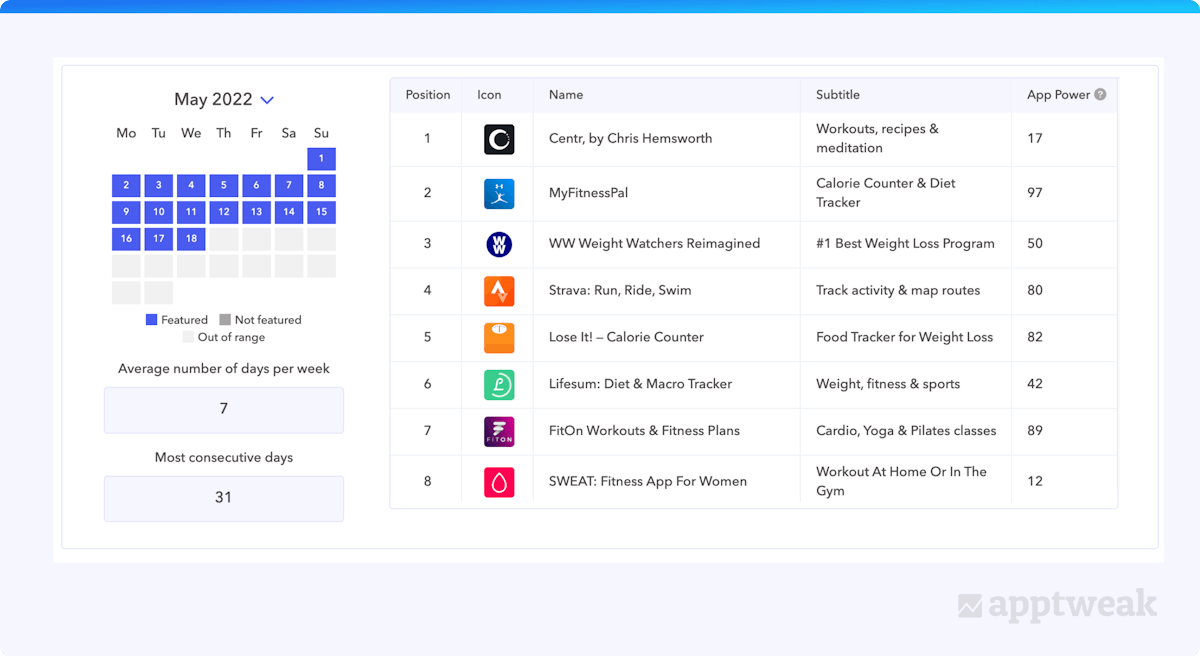
The calendar view just below the scorecards shows you exactly on which days the “Story” was visible on the store, while the table on the right contains all the apps included in the Story, with their app power or estimated downloads.
Discover which keywords display “Stories” in search results
As you search on the App Store, you find various results, including search ads, organic results, app collections, subscriptions, and Stories. These Stories are often older featurings that continue to run on keywords, although they first appeared in the Today tab months ago.
Learn more about featured “Story” keywords
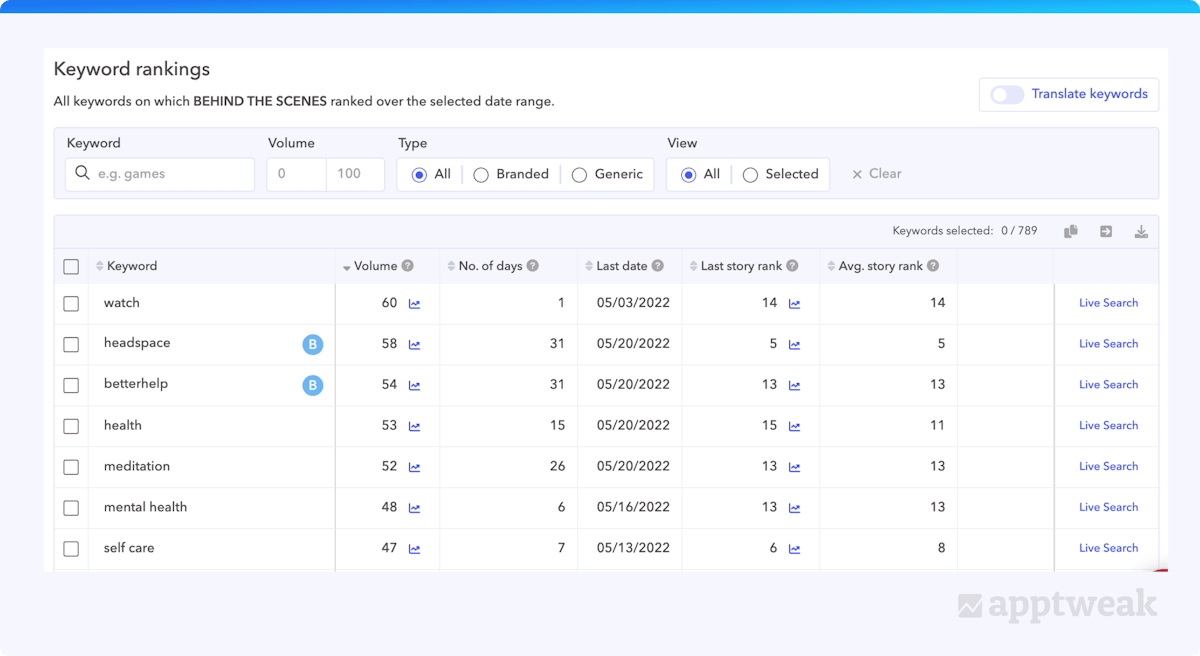
Stories that appear in keyword search results come under the “Search” filter, but sometimes also under “Today.” Scroll down to view keywords where the selected Story ranked for at least one day. They’re sorted by volume by default, but you can sort by “number of days” or “last date” to see top or recent keywords. To check the Story’s search result position, refer to the Last Story Rank column, which includes historical data.
Push keywords from Browse to your keyword list(s)
Find any interesting keywords that you’d like to add to your keyword list(s)? Select the keywords and use the “Push to keyword list” button at the top right of the table.
After selecting the destination lists, just click on “Push.”
.png?auto=format,compress&q=75&w=1200)
Estimate impact of being featured in a “Story”
It can be difficult to estimate the share of App Store Browse traffic that can be attributed to a featuring.
We simplified ASO by offering a formula to measure featurings’ impact. In the Impact tab, users with synced App Store Connect accounts see a chart of their App Store Browse traffic, including downloads, page views, and impressions.
On this chart, you will find vertical lines marking the dates when the main app was featured in a Story.
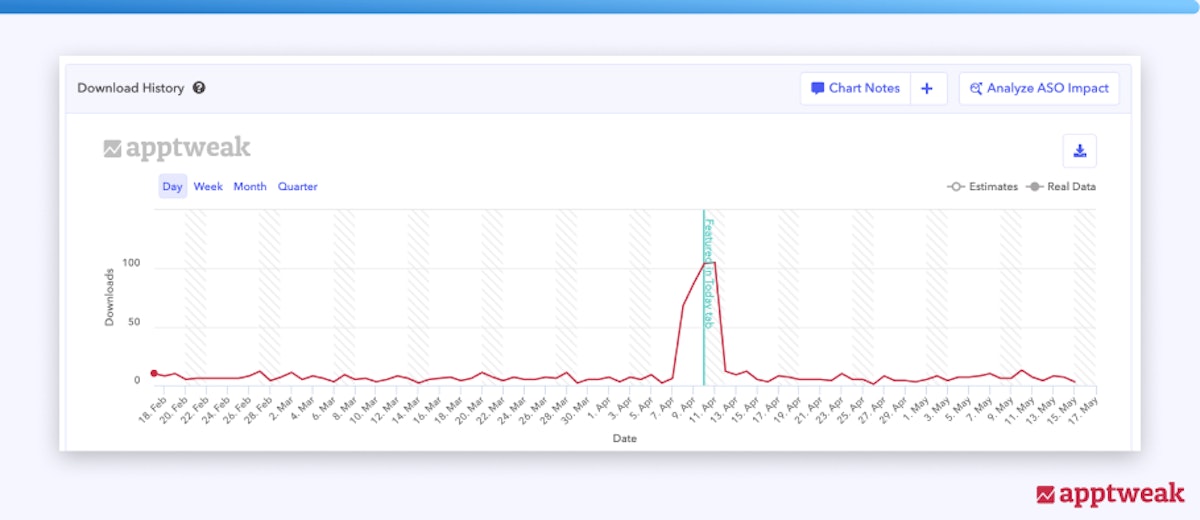
The table below the charts estimates downloads, page views, and impressions from each Story.

For example, this app gained an uplift of 98 downloads, 1.5K product page views, and 17.5K impressions. Although it may seem small, this represents a 1633% increase in downloads!

How do we attribute traffic to a featuring?
We compare the median daily downloads (or page views/impressions) from the last 30 days with the value on the featuring date. If the variation is positive, we consider the uplift to be attributed to the featuring.

Of course, this is just an estimation. The formula isn’t perfect and may be skewed by variables affecting your app’s Browse traffic during the featuring.
So that’s our Browse/Explore section! We hope it helps you assess your app’s visibility post-featuring and uncover new keyword opportunities to boost traffic.


 Georgia Shepherd

 Alexandra De Clerck
