How do top apps and games use metadata, ratings, and in-app events to win visibility? And what does it cost to acquire users through Apple Ads?
These are some of the questions we answer in our latest benchmark report. It analyzes the top 1,000 apps and games in the U.S. across the App Store and Google Play, and, new this year, benchmarks from around 2,800 U.S. Apple Ads advertisers tracked by AppTweak.
The ASO & Apple Ads trends and benchmarks report 2026 is your blueprint for what top-performing apps and games are doing right now to win visibility, conversions, and paid performance across the App Store and Google Play.
ASO & Apple Ads trends and benchmarks 2026
Get the latest data insights and industry benchmarks to optimize your app store strategy and drive growth.
Download reportKey takeaways
- 51% of top games on the App Store ran more than 5 in-app events in 2025, up from 46% in 2024 and 38% in 2023.
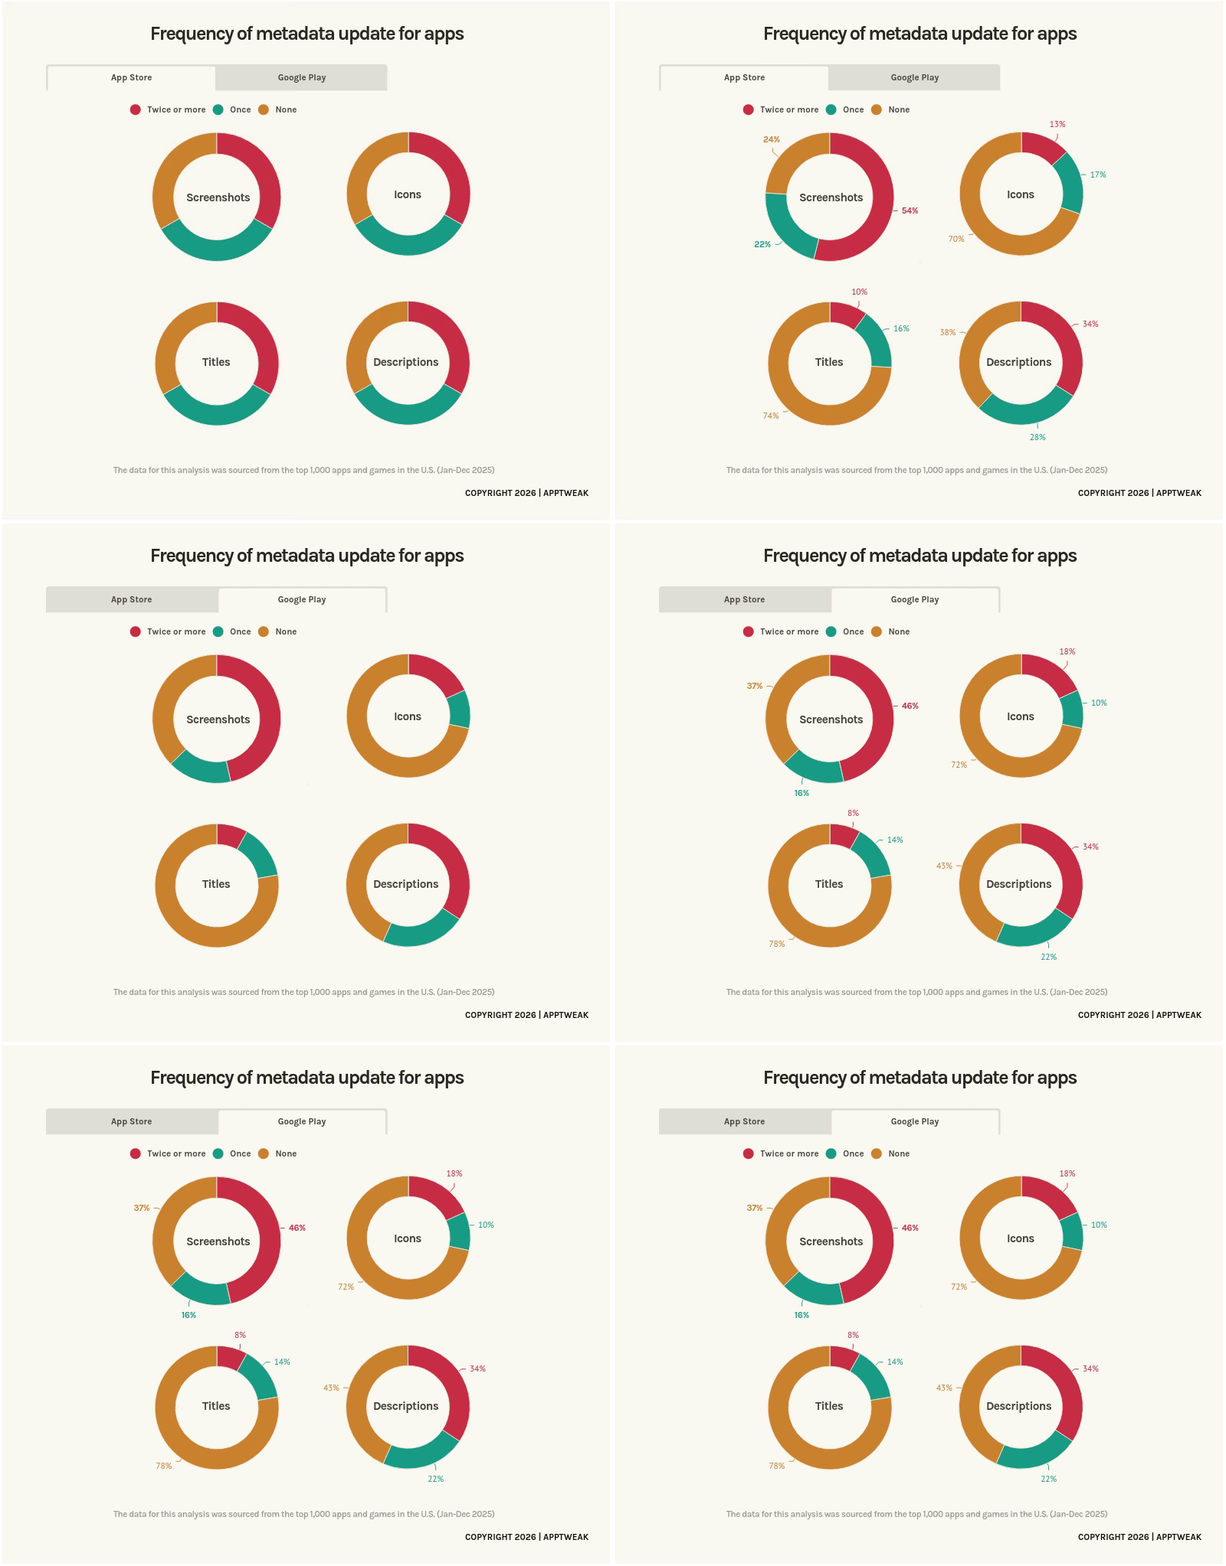
- 54% of top apps on the App Store and 46% on Google Play updated their screenshots twice or more in 2025, making screenshots the most-refreshed metadata element.
- 34% of top apps on both stores updated their description twice or more, a relevant signal now that AI search engines draw on descriptions.
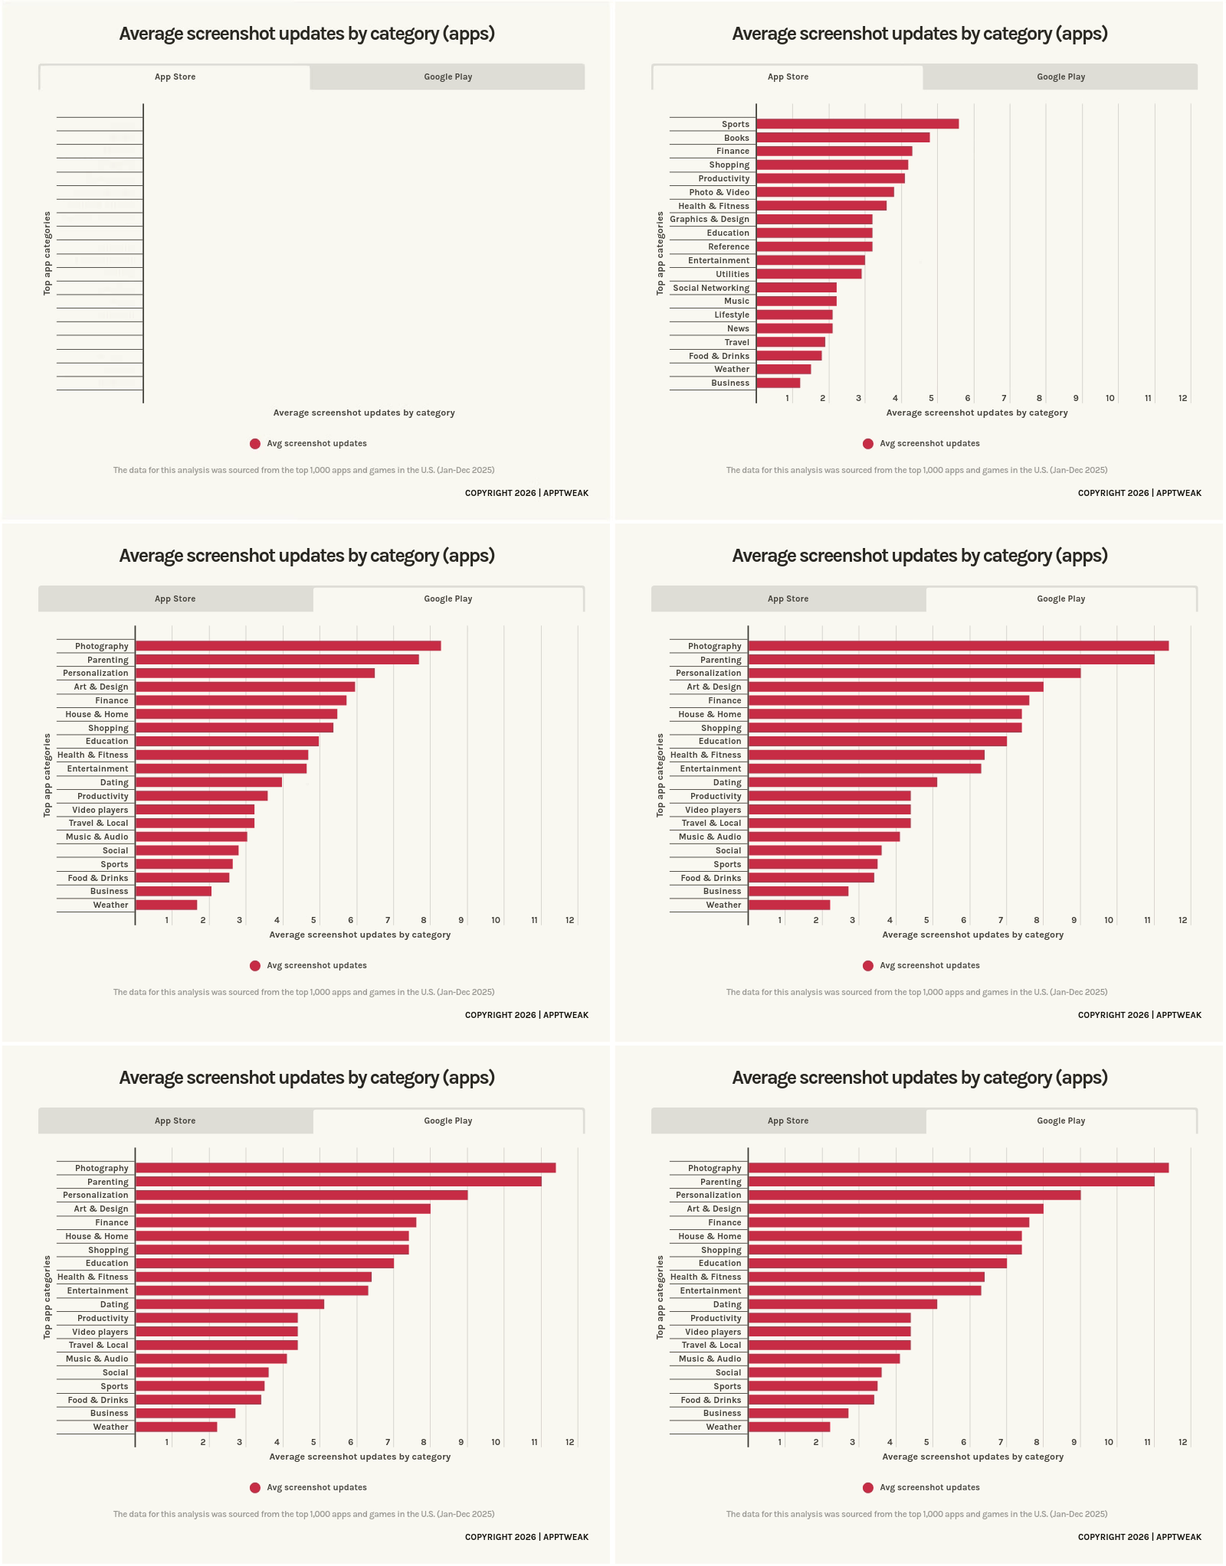
- Around 95% of featured apps on the App Store are rated 4.0 or higher, and 65% sit at 4.6 or higher (U.S., 2025).
- Apps using custom product pages in Apple Ads convert taps to installs at 58.7% versus 55.5% on the default page, yet 61% of apps and 74% of games ran none in 2025.
- After Apple Ads introduced additional ads in App Store search results in March 2026, Discovery campaigns saw the largest reach gains (impressions +44.9%, installs +35.8%).
About the data
The report covers the United States, full-year 2025 (January to December), across the App Store and Google Play, with year-over-year comparisons to 2024 where relevant. The organic ASO chapters (metadata, ratings, in-app events, custom store listings) are based on the top 1,000 apps and games in the U.S. tracked by AppTweak.
The Apple Ads chapter is based on ~2,800 advertisers running U.S. Apple Ads campaigns tracked by AppTweak over the same period. It is paid media data and does not include revenue, ROAS or lifetime value.
What’s inside this report
The report is organized in five chapters: metadata, organic visibility and creatives (update frequency, A/B testing, localization); ratings and reviews; in-app events and promotional content; custom product pages and custom store listings; and Apple Ads benchmarks by category, campaign type and month. Each chapter breaks results down by apps and games, App Store and Google Play, and category.
A first look at the data
Here are four findings from the report to give you a sense of what is inside.
1. How often top apps update their metadata
Screenshots are the most-updated metadata element on both stores. In 2025, 54% of the top 1,000 apps in the U.S. updated their App Store screenshots twice or more, and 46% did so on Google Play. Descriptions come next: 34% of top apps updated their description twice or more on both platforms, while 38% on the App Store and 43% on Google Play did not touch it at all. With AI search engines pulling store descriptions to build recommendations, an untouched description is worth reviewing.
Icons and titles barely move. 69% of top apps on the App Store never changed their icon in 2025, and 74% never changed their title. Games are the exception on icons: more than half of top games updated their icon on Google Play last year.
Popular titles update more often. The most-downloaded apps and games refresh their metadata more frequently than lower-ranked ones, most clearly among games: the top 20 games on Google Play updated their screenshots 12.75 times a year on average, against 4.44 for games ranked 500 to 1,000.
A/B testing follows the same focus. On the App Store, 35% of top apps and 33% of top games ran two or more screenshot tests, while around 90% of top apps never tested their icon and 88% never tested a video. Google Play sees more testing: 42% of top apps and 51% of top games ran two or more screenshot tests.
Localization is widespread for subtitles and descriptions (around 92% of top apps localize both on the App Store) and lower for titles (71%). Japan is the market where top apps localize their titles most, followed by Germany, France, Spain and Canada.
2. How ratings relate to rankings and featurings
Higher-rated apps rank for more keywords in the App Store top 10. Among the top 1,000 apps in the U.S. in 2025, apps rated 4 stars ranked for 4.4 top-10 keywords on average, more than triple the 1.3 of 1-star apps, with 3-star apps in between at 2.2. The link is correlational: higher-rated apps can also differ in size or maturity.
Ratings also track closely with editorial visibility. Around 95% of featured apps on the App Store are rated 4.0 or higher, and 65% sit at 4.6 or higher. On Google Play, around 96% of featured apps are rated 4.0 or higher. On both stores, fewer than 5% of featured apps sit below 4 stars, which makes ratings and review management a prerequisite for featuring rather than a nice-to-have.
3. How top apps and games use in-app events
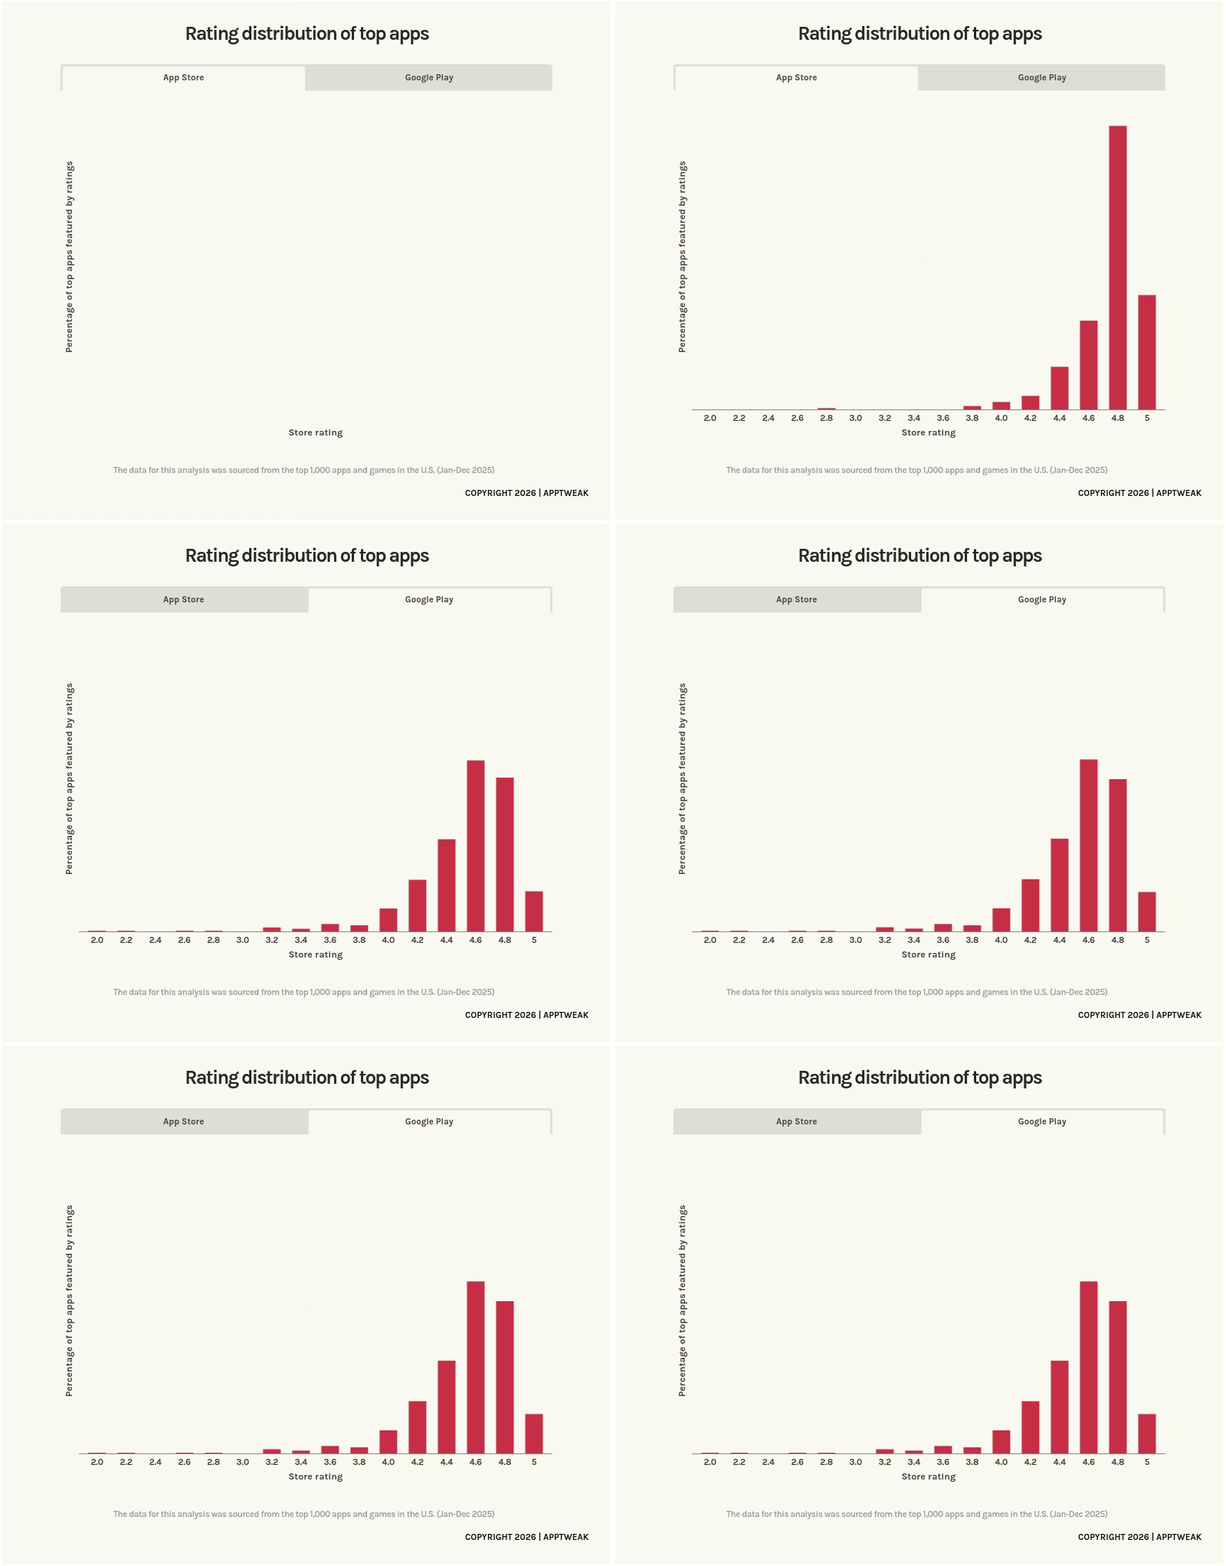
In-app events are now standard practice for top games. On the App Store, 51% of top games ran more than 5 in-app events in 2025, against 38% of top apps. That share has grown for three years in a row, from 38% in 2023 to 46% in 2024 and 51% in 2025. On Google Play, 51% of top games used promotional content more than 5 times, against 34% of apps.
Special events are the most common format on both stores. On the App Store they make up 37% of app events and 42% of game events. Apps lean on major updates (25%) and live events (15%), while games use more competitive formats such as challenges (13%) and competitions (6%). Offers stay rare on Google Play, under 10% for both apps and games.
Content and media apps run the most events. Entertainment leads App Store app categories at 21.6 in-app events per year, followed by Books (19.8) and Sports (19.5). Among games, Casino leads at 25.5 events per year, ahead of Strategy (24.0).
4. Custom product pages and custom store listings
Most advertisers still send Apple Ads traffic to their default product page. Among ~2,800 U.S. Apple Ads advertisers tracked by AppTweak in 2025, 61% of apps and 74% of games ran no custom product pages in their campaigns. Only 20% of apps and 7% of games used custom product pages more than 5 times in the year. Apps and games that used them converted taps to installs at a higher rate: 58.7% versus 55.5% for apps (+3.2 points) and 56.8% versus 54.0% for games (+2.8 points). Photo & Video apps use the most custom product pages, at 8.3 per year on average, followed by Health & Fitness (6.8) and Education (5.8).
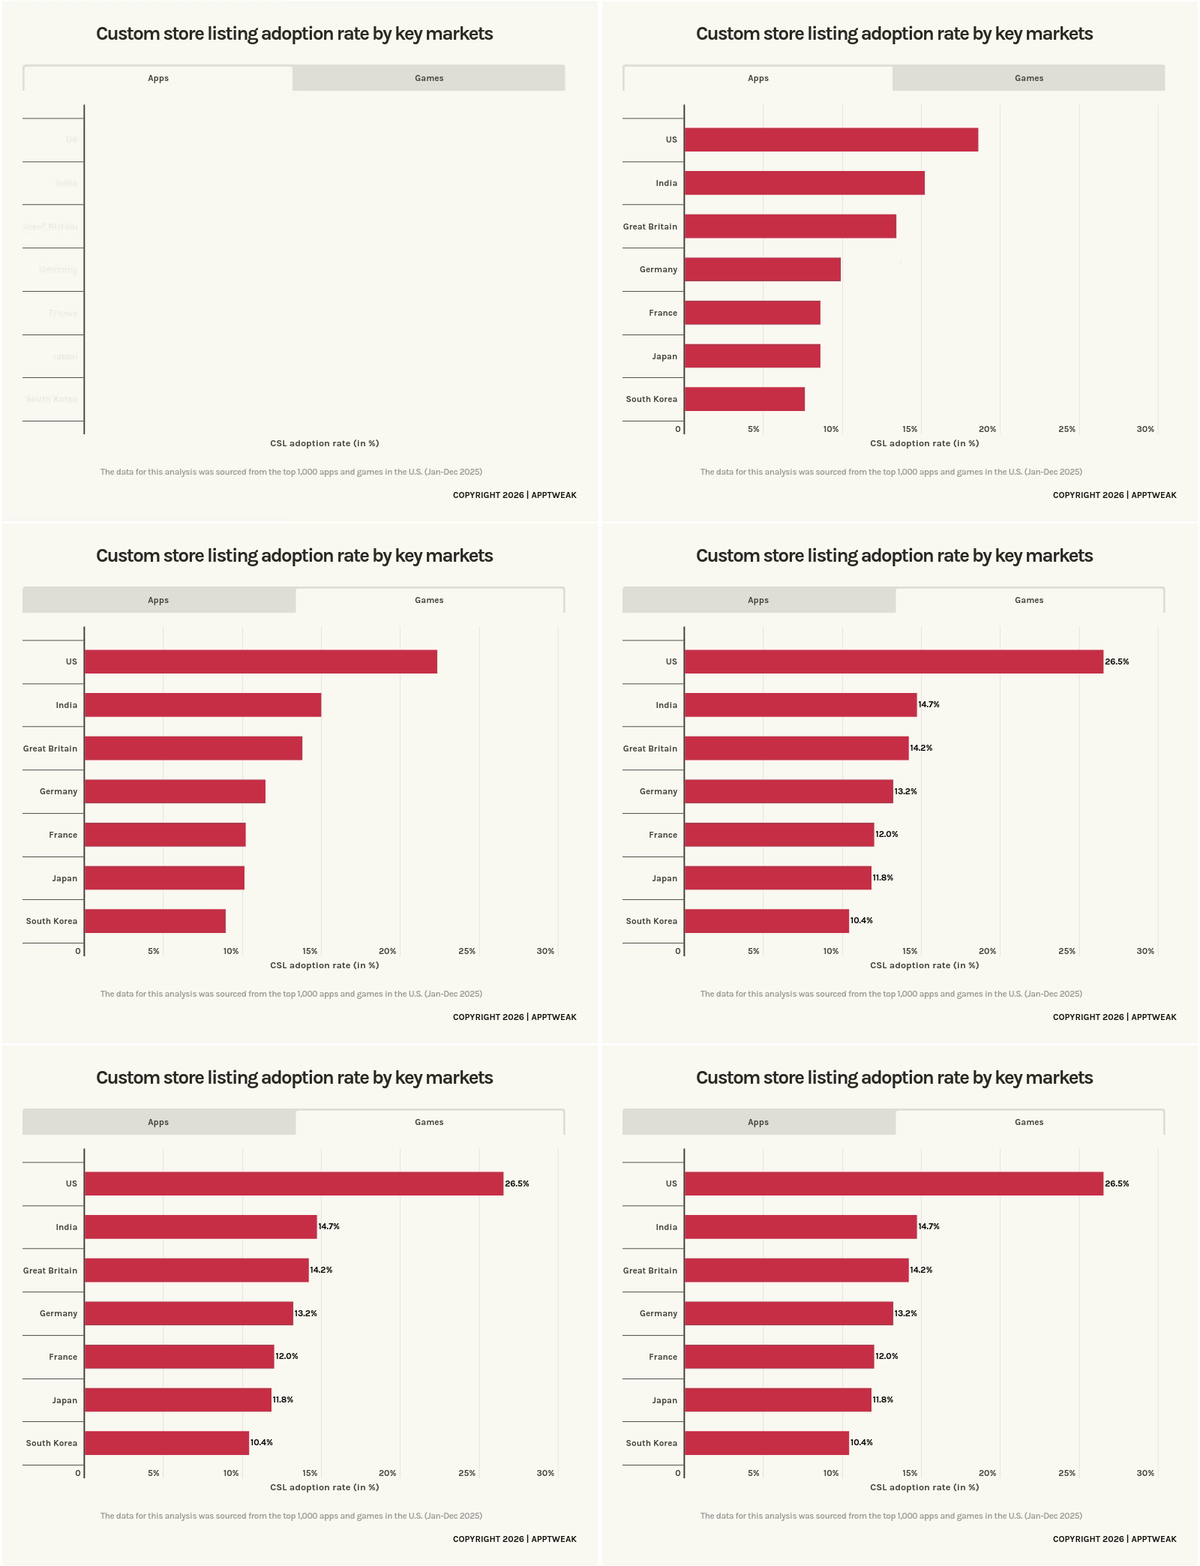
On Google Play, custom store listings (CSLs) are alternate listings targeted by country, campaign or user segment. The U.S. leads CSL adoption: 18.6% of top apps and 26.5% of top games run at least one. Games adopt CSLs more than apps in every key market except India.
Apple Ads benchmarks by category and campaign type
The report’s fifth chapter benchmarks Apple Ads for ~2,800 U.S. advertisers tracked by AppTweak in 2025. Median cost per install (CPI) in search results ranged from $1.33 for Shopping to $26.70 for Sports, with Games at $4.63. Cost per tap (CPT) runs below each advertiser’s own annual average through Q1 and rises toward the holidays, peaking at +8.8% in November for Generic campaigns. And after Apple Ads introduced additional ads in search results in March 2026, Discovery campaigns saw impressions rise 44.9% in the following 28 days.
See the full breakdown by category, campaign type, month and placement in our Apple Ads benchmarks 2026.
See how your app store strategy stacks up
The report brings organic ASO and Apple Ads benchmarks together in one place, so you can compare your update cadence, testing, ratings, events and paid costs with the top apps in your category. Start with your weakest lever: an untouched description, an untested icon, or Apple Ads traffic that still lands on the default page.
ASO & Apple Ads trends and benchmarks 2026
Get the latest data insights and industry benchmarks to optimize your app store strategy and drive growth.
Download reportHow often do top apps update their App Store screenshots?
In 2025, 54% of the top 1,000 apps in the U.S. updated their App Store screenshots twice or more, and 46% did so on Google Play, according to AppTweak’s ASO and Apple Ads report 2026. Screenshots are the most frequently updated metadata element on both stores.
Do top apps A/B test their icons?
Rarely. Around 90% of the top 1,000 U.S. apps never A/B tested their icon on the App Store in 2025, and around three-quarters never did on Google Play (AppTweak, 2026). Screenshot tests are far more common: 35% of top apps ran two or more on the App Store.
What rating do featured apps have on the App Store?
Around 95% of apps featured on the U.S. App Store in 2025 were rated 4.0 stars or higher, and 65% were rated 4.6 or higher, based on AppTweak’s analysis of featured apps among the top 1,000. On Google Play, around 96% of featured apps were rated 4.0 or higher.
How many in-app events do top games run?
51% of the top 1,000 games on the U.S. App Store ran more than 5 in-app events in 2025, up from 46% in 2024 and 38% in 2023. Casino games ran the most, at 25.5 events per year on average (AppTweak, 2026).
Which countries do apps localize their metadata for most?
Among the top 1,000 U.S. apps in 2025, Japan was the market where apps localized their App Store title most, followed by Germany, France, Spain and Canada. Spain, Mexico, Argentina and France led on description localization on both stores.
How common are custom store listings on Google Play?
In 2025, 18.6% of top apps and 26.5% of top games in the U.S. ran at least one custom store listing on Google Play, the highest adoption among the key markets AppTweak analyzed, ahead of India and the United Kingdom.


 Micah Motta

 Pierre-Antoine Roy

 Nathalie