
By using App Store Connect, app marketers can track the impact of their App Store Optimization (ASO) efforts and make data-driven decisions to improve their app’s visibility and increase downloads. However, it can be sometimes difficult to navigate through App Store Connect and have a clear understanding of what the available data – metrics and conversion rates – means.
In this blog, we present you the metrics and conversion rates available on App Store Connect, what influences them, and how to interpret them to better direct your marketing efforts and increase your downloads.
App Store Connect metrics
Impressions
Impressions are broadly defined by Apple as: “The number of times your app was viewed on the Today, Games, Apps, and Search tabs of the App Store. Includes Product Page Views.” Impressions are registered after the icon of the app was viewed for more than one second anywhere on the App Store.
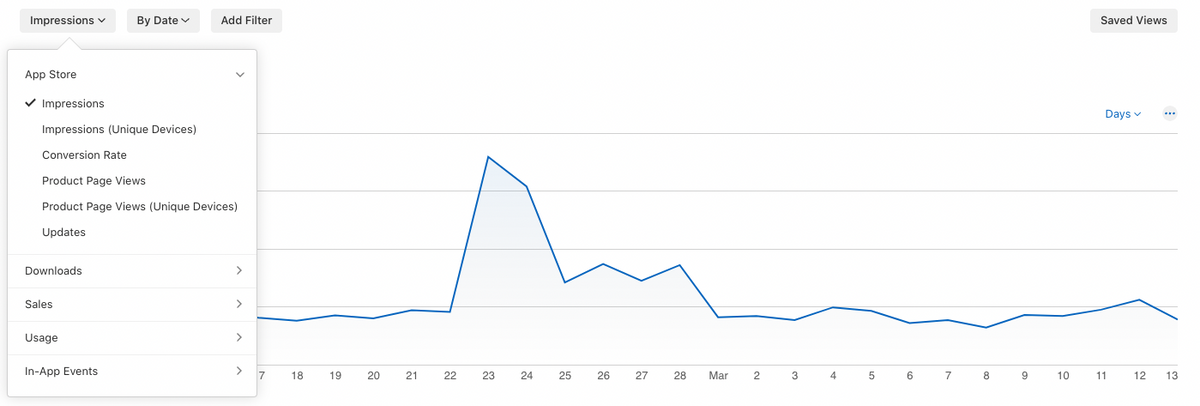
App Store Connect gives you the option to track a second metric: Impressions (unique devices). This helps you measure first-time impressions, as in the first time store visitors see your app anywhere on the App Store on one specific device.
Impressions allow you to measure the visibility of your app, but they should not be the end goal of your ASO strategy as they do not necessarily lead to a download. For instance, looking at AppTweak, the estimated “impressions to installs rate” for the Games category in 2022 was 1.7%. Keyword optimization and featurings can have a big impact on the number of impressions you get.
Expert Tip
Did you know? Apple takes into consideration the performance of your app for the keywords you target. If these lead to installs, you’ll go up in the search results for queries that include these keywords; otherwise, you’ll go down. Hence the importance of targeting relevant keywords in your metadata and optimizing their conversion rate.Additional filters: Device, Platform Version, Page Type, Region, Source Type.
Product page views
Product page views are registered each time your app page is viewed by a store visitor. Only product page views coming from devices running on iOS 8, tvOS 9, macOS 10.14.1, or later, are registered.
As with impressions, App Store Connect provides a second metric: Product page views (unique device), which corresponds to first-time product page views on one specific device.
Page viewers are store visitors who have already shown interest in your app – keep this in mind when building your product page. Make sure you don’t repeat yourself. Highlight the benefits, unique selling propositions, and use cases of your app while remaining concise. Optimize your ratings and reviews – 79% of store visitors check them before installing an app.
Additional filters: Device, Platform Version, Page Type, Region, Source Type.
Updates
This is a simple metric that tracks the number of times your app has been updated to its latest version by your users.
If you recently added a new feature to your app, this metric can help you understand what percentage of your user base has already access to it. It also informs you when you should start evaluating the success of this new feature.
Additional filters: App Download Date, Device, Platform Version, Region, Source Type.
Downloads
First-time downloads
This metric measures the number of devices that installed your app for the very first time only.
Redownloads
Redownloads help you measure re-engagement with your app, when users who uninstalled your app at some point of their journey decide to reinstall it. It’s especially useful to tell if a change you made to your app, for instance a new feature, was enough to re-engage churned users.
Redownloads are across all devices: a store visitor who downloads your app on their iPhone and then decides to install it on their laptop will increase the number of redownloads by one. Auto-updates and device restores are not registered as redownloads.
Total downloads
Total downloads add up first-time downloads and redownloads. This metric provides you a useful overview of your overall app performance, while the two metrics taken individually give you a more detailed view of your users’ behavior.
Additional filters for all downloads metrics include:
- App download date
- Device
- Platform version
- Page type
- In-app event
- Region
- Source type
Expert Tip
Other metrics are available on App Store Connect: sales, usage, and in-app event metrics. Sales metrics track everything related to the revenue generated by your app on the App Store. Usage (in-app) metrics focus on everything that comes after your app has been installed – pay attention to the launch rate and retention rate, both of which can have an impact on your ASO. In-app event metrics track how many users are discovering your in-app events on the App Store as well as how engaged users remain with your app over time.Importance of App Store Connect’s filters
App Store Connect provides you with filters that can be applied to the console’s data. These filters allow you to read your data in greater detail, eventually helping you better understand your traffic’s behavior. Applying these filters can, for instance, help you better understand on which device or in which region you get the most impressions.
With downloads, you have access to two additional filters – one for the date when your app was downloaded and one for the performance of your in-app events.
App Store Connect source types
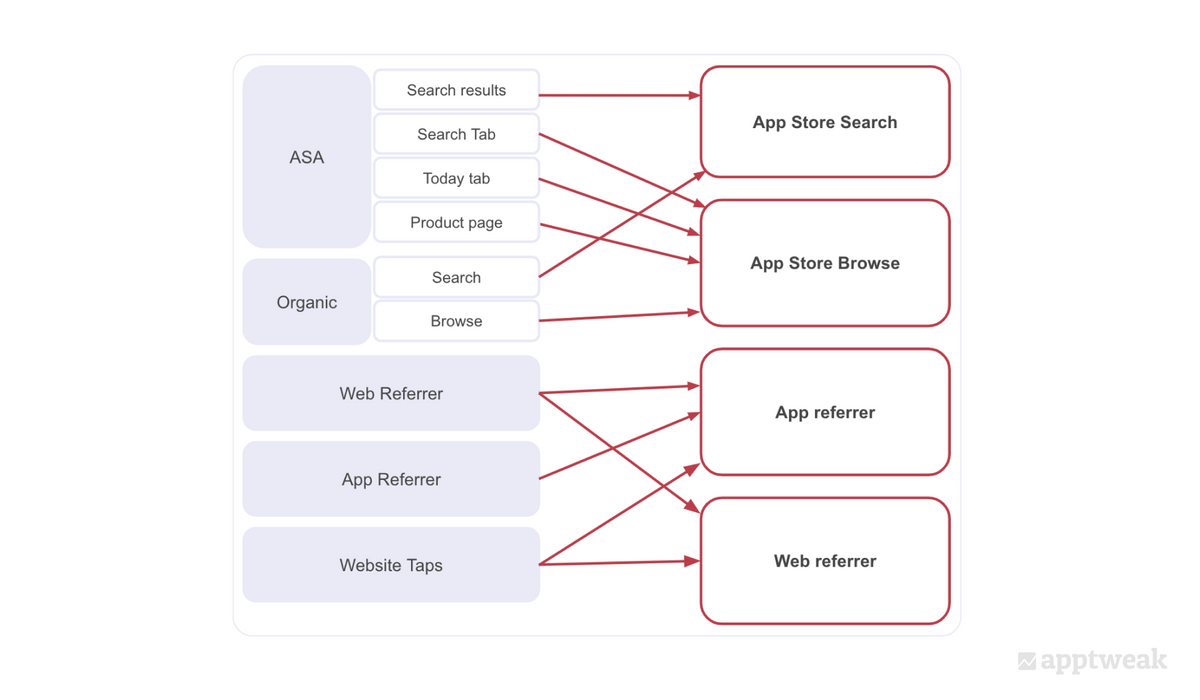
Source types are a useful filter available on App Store Connect to help you determine where your impressions, page views, and downloads come from. The 4 main traffic source types are:
- App Store Search
- App Store Browse
- App Referrer
- Web Referrer
Here’s a summary table that recaps the source type that each type of traffic is attributed to by App Store Connect:
Expert Tip
Additional source types are available on App Store Connect: Institutional Purchase, Unavailable, and Event Notification. Institutional Purchase indicates your was bought under Apple’s Volume Purchase Program.Discover our in-depth guide to App Store and Google Play’s traffic sources
App Store Connect conversion rates
On App Store Connect, you have access to the conversion rate of your app, a very general term that actually measures the number of downloads you get based on the number of Impressions.
However, thanks to the metrics available on the App Store Connect, you can also calculate other conversion rates that allow you to better understand the performance of your app: the click-through rate and the app page conversion rate.
Conversion rate: Impressions to downloads
First-time downloads / impressions (unique devices)
Impressions to downloads’ conversion rate measures the number of downloads you get from store visitors who saw your app for the first time on the App Store. If a store visitor sees your app in the search results or in a featuring, but first decides to view your app page before downloading it, then it is not counted as a download in this conversion rate.
Search conversion rate
For the Search source, the first impression happens in the search results – be it an ad or an organic result. This conversion rate helps you measure the conversion potential of your app page’s assets that appear in the search results: icon, title, subtitle, first screenshot(s) and/or preview video, average rating, and total ratings.
The Search source usually has a higher conversion rate than the other source types. This is first because this type of traffic is actively looking for an app that has features similar to your app and is in the mindset to download a new app.
Second, your app’s conversion rate can be boosted by store visitors who search for your brand term. These store visitors usually have already made up their mind and download your app as soon as they see it appear in the search results.
Browse conversion rate
When it comes to the Browse source, it’s less likely that store visitors will download your app as competition is more fierce. In the vast majority of cases, your app appears alongside a list of other similar apps with a limited number of information being displayed: icon, title, and subtitle.
Furthermore, the mindset of Browse’s traffic is vastly different, as store visitors are not necessarily looking for an app like yours when browsing the App Store. You also have fewer selling points to present to store visitors because of the limited amount of information being displayed in Browse.
Apple highlights a lucky few apps in more “advanced” featurings that are put on the forefront of the App Store. This can potentially boost your app’s Browse conversion rate during the time of such a featuring. These advanced featurings require you to send custom creatives to Apple, so the conversion rate boost you may notice in such occasions is usually not dependent on your actual app page’s assets. These featurings are unusual unless you’re a market leader.
Find out how to get your app featured on the App Store and Google Play
App Referrer and Web Referrer conversion rates
Traffic coming from the App Referrer and Web Referrer sources immediately lands on your app page, not seeing any other part of the App Store beforehand. It is, therefore, automatically counted as a page view.
As a result, all your app page’s assets have an impact on this conversion rate, the most important of which are your creatives (icon, screenshots, and/or preview video), your reviews, and your ratings (average and total).
Discover how to increase your app page’s conversion rate
Additional conversion rate filters: Device, Platform Version, Product Page, Page Type, Region, Source Type.
Click-through rate: Impressions to page views
Page views (unique devices) / impressions (unique devices)
Click-through rate (CTR) measures the number of store visitors who clicked on your app the first time they viewed it on the App Store, leading to a page view. This is an intermediate conversion rate that is less important because it does not measure downloads.
- For the Search source, the assets that weigh the most on CTR are the assets of your app page that are directly visible in the search results. If your CTR increases, this might indicate that these assets are performing well but are not sufficiently conversion-oriented to lead to a download and/or do not properly highlight your app’s unique selling proposition.
- For the Browse source, besides the custom creatives you provide to Apple, your app page’s icon, title, and subtitle are the three assets that have the biggest impact on CTR. Browse’s CTR is usually higher than the Browse impressions to downloads’ conversion rate. This is because store visitors who see your app page in the Browse section of the App Store are shown little information about your app. Browse’s traffic is thus more likely to click through to your app page to find answers to their questions.
- The traffic attributed to the App Referrer and Web Referrer sources lands directly on your app page and is automatically counted as a page view. As a result, the CTR for the App Referrer and Web Referrer is always null (displayed as 100% on AppTweak).
App page conversion rate: Page views to downloads
First-time downloads / Page views (unique devices)
Page views to downloads’ conversion rate measures the number of downloads that originated from your product page the first time it was viewed. It helps you better understand the effectiveness of all your app page’s assets for conversion, whereas click-through-rate is only about a fragment of your app page’s assets.
Assets that weigh most on this conversion rate are your app page’s creatives (icon, screenshots, video), reviews, and ratings (total and average). The first lines of your description can also play a role in conversion.
If you filter by the Search source, you will notice that the app page conversion rate is sometimes higher than 100%. This is because first-time downloads include downloads coming from page views plus search results. This results in the number of first-time downloads being sometimes higher than the number of page views.
For the App Referrer and Web Referrer sources, since the traffic attributed to them is automatically counted as a page view, the App and Web Referrer’s page views to downloads conversion rate is the same as the impressions to downloads one.
Connect your App Store Console to AppTweak
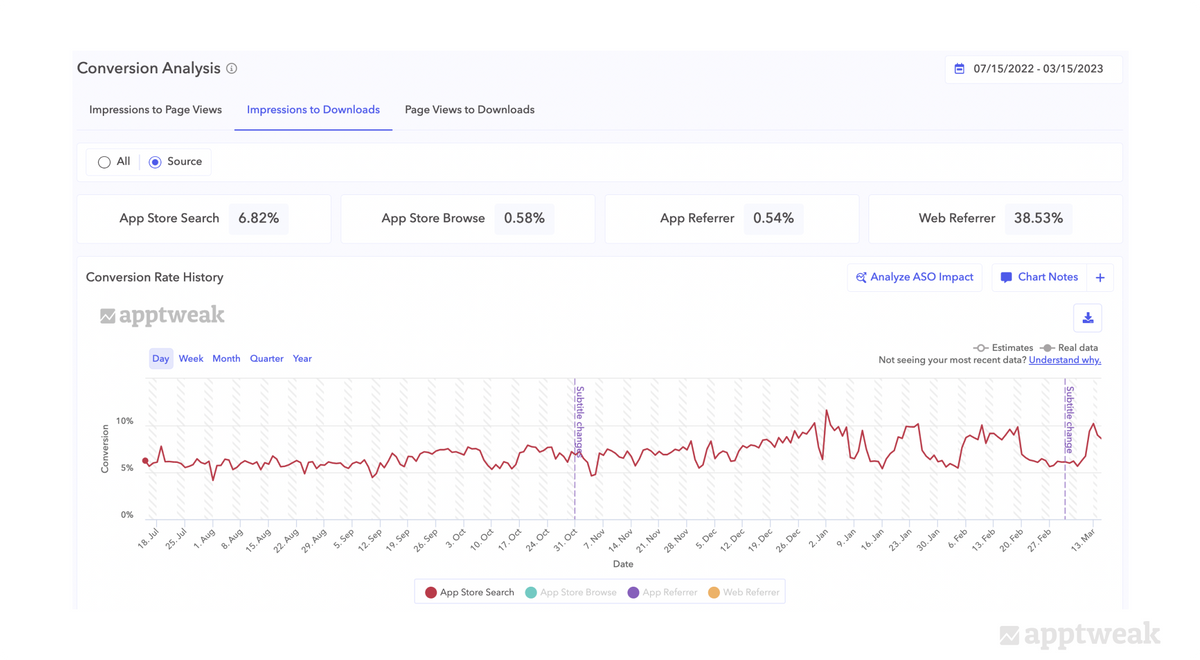
Connecting your App Store Connect console to AppTweak has several advantages, one of which is automatically calculating the click-through rate and app page conversion rate. AppTweak also provides you with a graph that shows their evolution overtime, helping you better visualize your data.
On these graphs, you can use AppTweak’s Analyze ASO Impact feature and add filters to plot the conversion rate against any event that took place on the App Store. This way, you can better correlate what may be the reason for an increase or decrease in your app’s performance.
Connect your App Store Connect console to AppTweak
Conclusion
App Store Connect provides valuable data points for app marketers to track the performance of their app and make informed, data-driven decisions to improve their ASO strategy. By leveraging – and understanding – all available metrics and conversion rates, you’ll be more familiar with your users’ behavior and know where to focus your ASO efforts.


More articles in Advanced ASO

 Georgia Shepherd

 Micah Motta

 Oriane Ineza