
iOS8 iTunes Connect: new Design, new Data!
At its Worldwide Developer Conference, Apple announced a huge update to iTunes Connect. Developers will now be able to get more analytics helping them to manage their apps and marketing campaigns. They will also be able to actually track their app engagement and retention throughout very interesting metrics on which we will focus in this blog article.
What’s new?
Along with a brand new design, app previews, app bundles and TestFlight beta testing, Apple introduced new analytics metrics that will be implemented in iTunes Connect with iOS 8.
Not only will these data actually help developers achieve success, they will also be completely free and very easy to use. Indeed, the services can be retrieved without SDKs, third party code nor specific integration … everything’s available on iTunes Connect directly.
Also, developers won’t need to update their apps to the App Store; everything will be done automatically. How cool is that? It seems like Apple is really trying to make app developer’s life easier.
So, what are these awesome new features? How can you use them for your business? Let’s have a closer look!
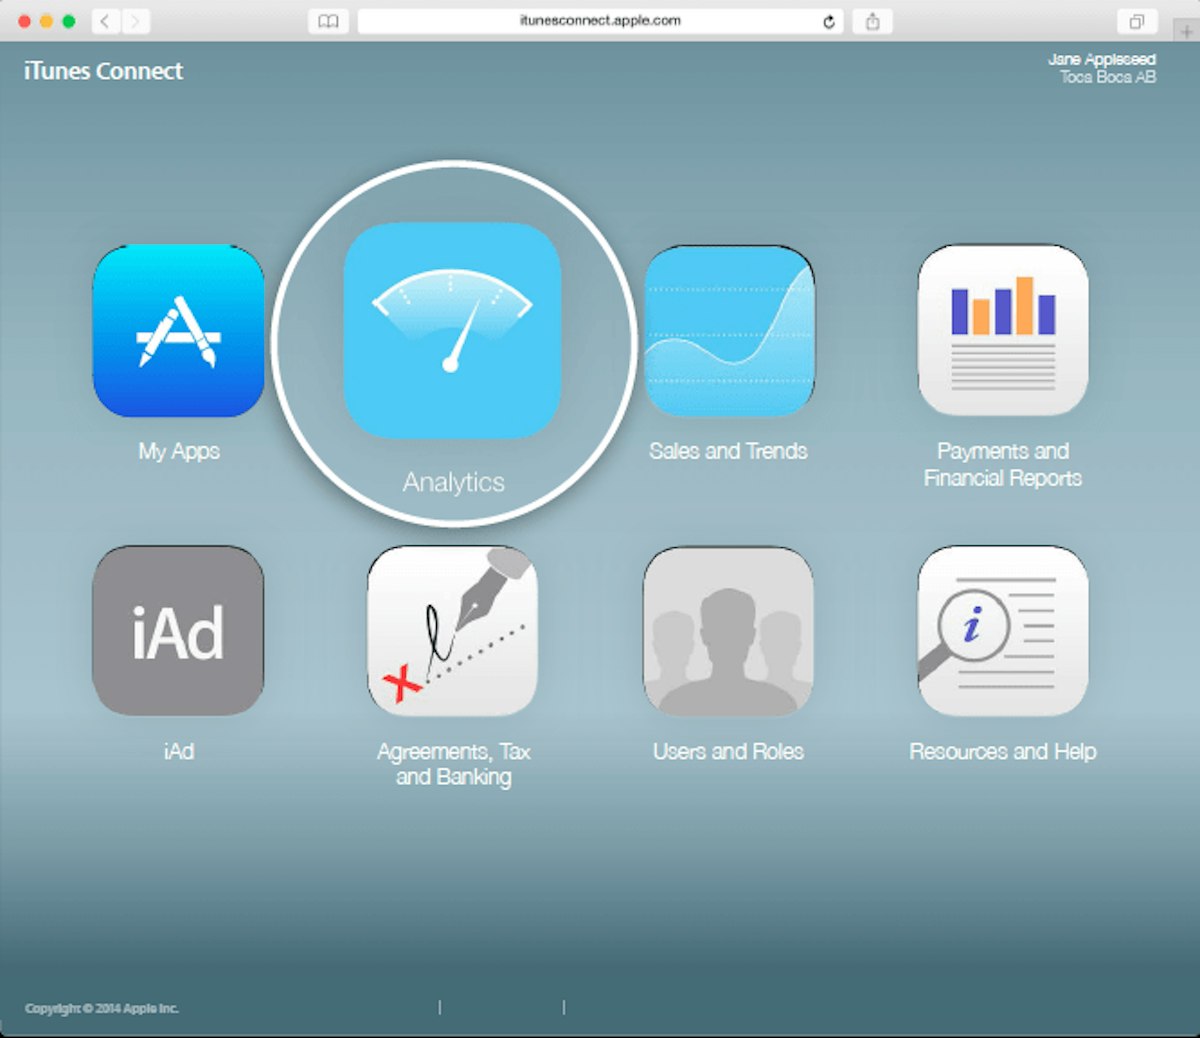
When clicking on the Analytics icon, the default page is a list of all your apps. You will have the possibility to check your App Store views, app units, sales, and sessions in the blink of an eye.
If you actually click on one of these specific metrics, you end up on the iTunes Connect Analytics Dashboard. From that page, you can navigate through a whole set of different metrics: acquisition, engagement, and retention app data are all available for you to track, analyze, and compare. You can also choose the period of time you want to monitor. Finally, you can filter these metrics by date, app version, platform, OS version, or territory.
You’ll find different graphs (lines, stacked areas, and bars) to ease your reading.
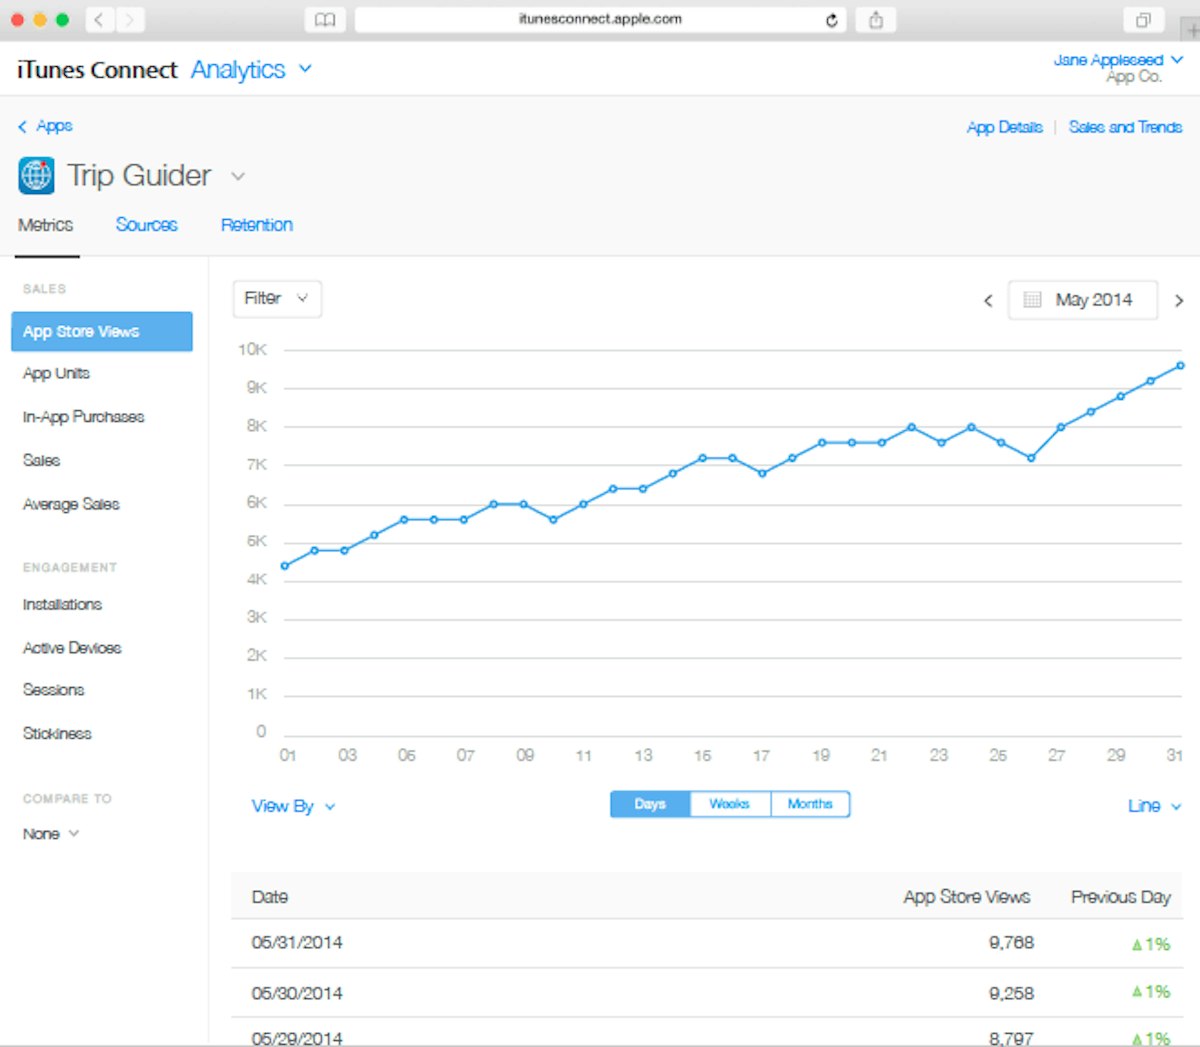
If you look closely at the left column, you will notice that there are 4 “Engagement” metrics:
- Installations
- Active devices
- Sessions
- Stickiness
These are the ones we’re going to focus on today, along with the “Retention” metrics.
From acquisition to engagement
It’s actually a major improvement made by Apple here. Enabling app developers to track their app engagement was something that was cruelly lacking in iTunes Connect.
But why are engagement metrics so important? According to Trystan Kosmynka, Engineering Manager, these analytics “will answer many questions and reveal new missed opportunities.”
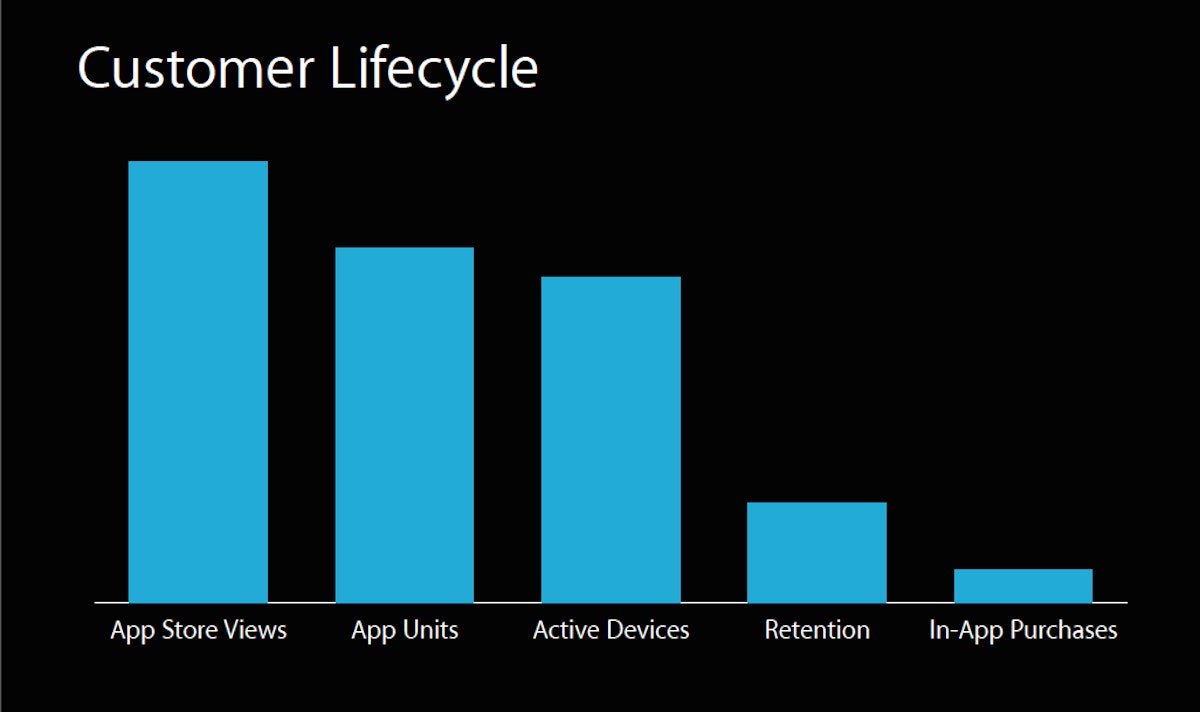
First of all, by having access to the so-called conversion funnel, thanks to the iTunes Connect customer lifecycle metrics, developers will have a precise insight into how their app is being treated by its users from the moment they acknowledge the app to the point where they actually make some in-app purchases.
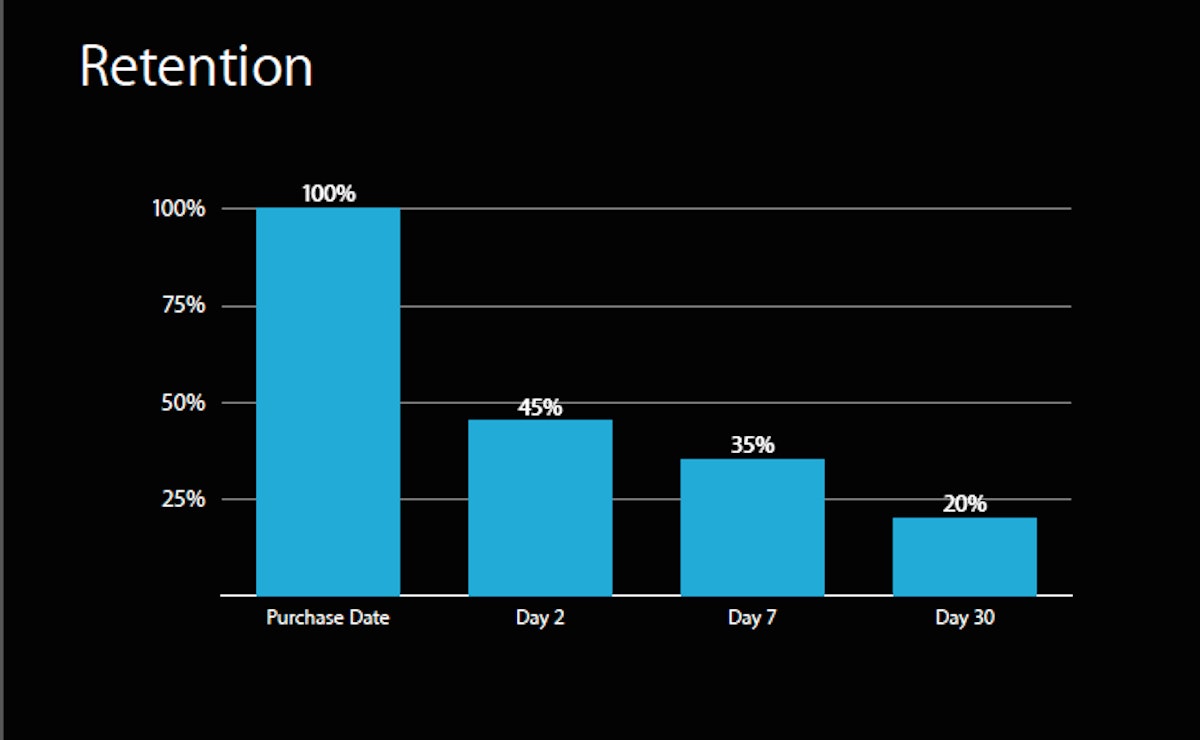
The graph below shows a drastic decrease within each step. This simply means that when a customer does install your app, it does not mean that he will keep on using it and be a paid customer. Some may even download your app and never use it again. It is, therefore, absolutely necessary to find out why and how you can remedy that.
 There’s actually a whole new set of metrics that can be monitored in order to track customers’ activity with an app.
So, as we said, once your customers have installed your app, you cannot consider your job to be done.
Four engagement metrics essential to track
1. Installations: Installs are obviously a very important metric to focus on. It will give you the total amount of your app installs. It can be interesting to filter these data by demographics, for example.
However, customers who purchased your app may have installed it on multiple devices as well. That’s where the app units metric intervenes, as it isolates each app install.
2. Active devices: This metric simply enables you to see what percentage of the total devices (on which your app has been installed) are actually active.
3. Sessions: Sessions are yet another important metric. It will give you the amount of sessions – or usage – of your app per customer. You will therefore be able to know if your app is being reused but also how many times, why, by who, when, and where. This metric will clearly help you in your app marketing strategy.
4. Stickiness: The stickiness factor is “a single measure that you can track over time to ensure that you’re both growing and retaining your customers.” Combining this data with the average sales per user can tell you how your app is doing and how your customers are performing.
If you track, analyze and compare these metrics, you will certainly end up with a great understanding of your market. This will allow you to answer many questions and provide the best answers.
Focus efforts on your app’s retention rate
Retention is a specific measure that Apple finally decided to give developers in order to simplify things for them. This metric shows how much customers are still using their apps over time, starting from the moment of purchase.
This is what it looks like:
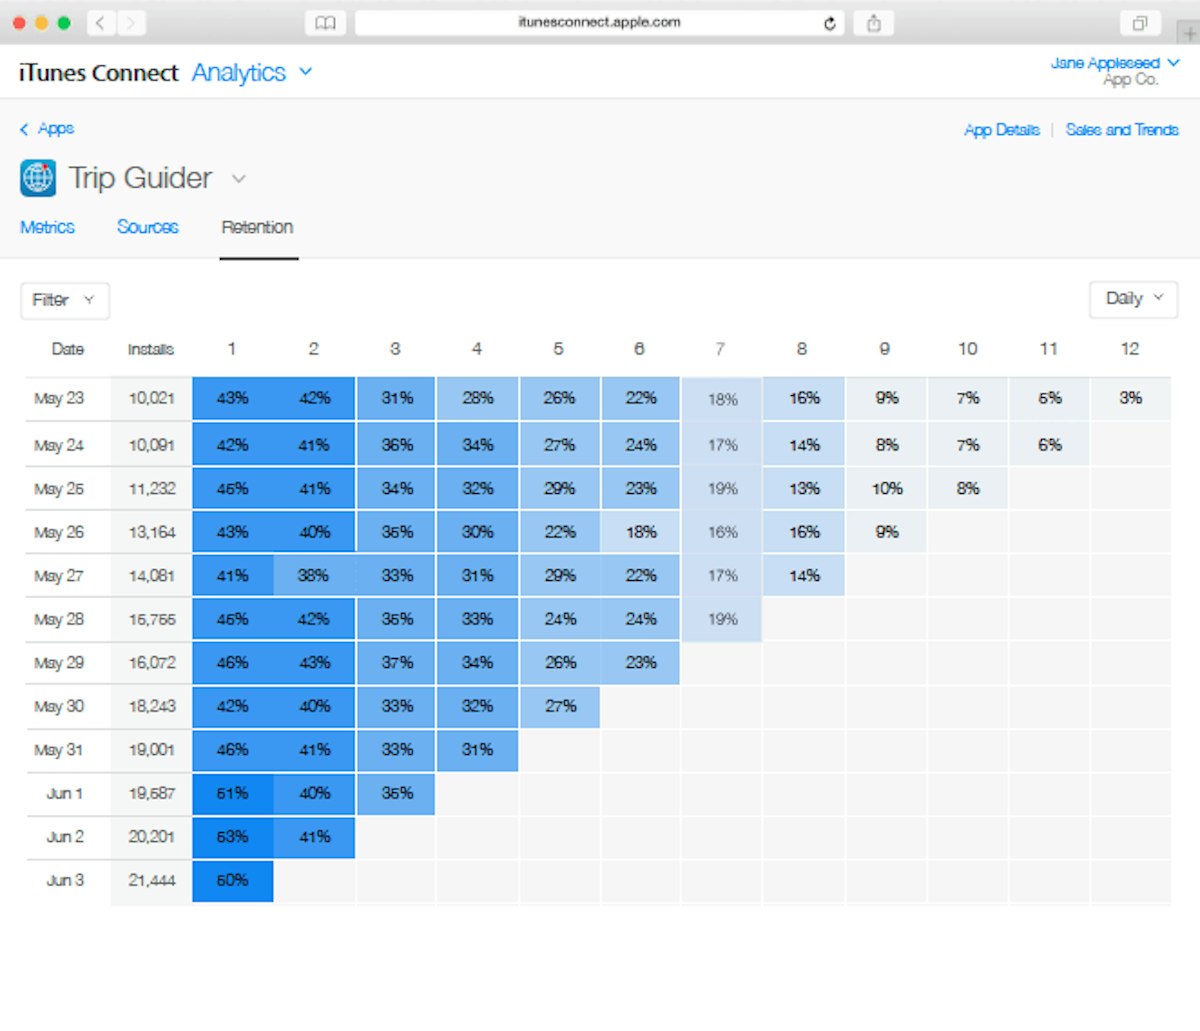
This grid offers is a very easy-to-read way of presenting the amount of retention per app installs over time. Starting from day 1, you will know day after day the amount of activity of your app and see the daily percentage of active users. As a quick example, if we look at the first row, we can see that of the 10,021 active devices that installed the app on May 23, 18% were active 7 days later.
Retention is an extremely important factor to take into account in order to understand how users apprehend your app. You will know if (and when) people are returning to their app or if they never used it again.
What about the algorithm?
Given that Apple is clearly taking a step forward in the app development ecosystem with all these new metrics, we can ask ourselves if the App Store algorithm will change in the same way. Are these new measures going to impact your app ranking?
We already know that the freshness factor (your app being updated and reviewed regularly) is already impacting the algorithm. But this was depending on you, app developers.
What about the freshness factor from a customer’s view? What if an app will actually rank higher if its retention rate is high and increasing? On the opposite, will apps with low retention rates rank down? We won’t have the answer but I’m ready to bet that this will be the new reality.
These changes also reveal the will of Apple to catch up with its fierce competitor, Google. Indeed, Apple’s entrance into the analytics space and the fact that everything will be open and free to app developers clearly indicates Apple’s will to be more transparent and less stingy with its data.
With the arrival of deep linking, it seems like the app industry is living a profound change. Probably being a consequence of the App Store saturation…
Looking for more information on the new iTunes Connect? Check out these useful resources:
AppTweak and iTunes Connect
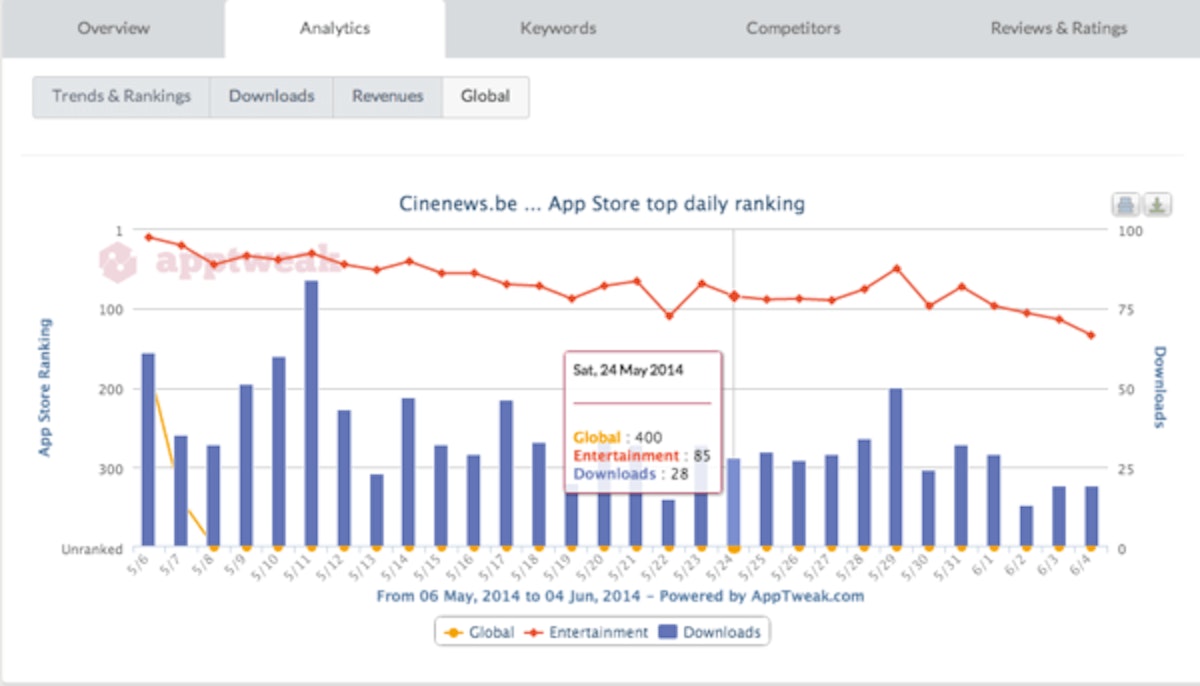
AppTweak, our app marketing platform, enables you to track your app downloads, revenues, updates and in-app purchases by login into your iTunes Connect account directly inside our website.
Moreover, AppTweak allows you to compare both downloads and rankings on the same graph! (see below)
It’s all for free and available right now on for everyone who owns and iTunes Connect account. It is actually avoiding you to switch from one website to another: everything is available on AppTweak!
We’re working on adding the new data that Apple is providing, and actually even more (but that’s a surprise!) to give our users all the insights they need to improve their app marketing. We will let you know when our new iTunes Connect version is out!
What do you think about the new iTunes Connect? Do you think that these new metrics will have an impact on Apple’s algorithm? Let us know!


 Sukanya Sur

 Oriane Ineza

 Micah Motta
